Best Practices for Building Distributed Systems
Overview
We will look at some of the best practices to be used during development of a distributed system.
A distributed system should always assume that things will fail and should be designed with fault tolerance (ability to deal with faults) & resiliency (ability to recover) in mind.
Github: https://github.com/gitorko/project57
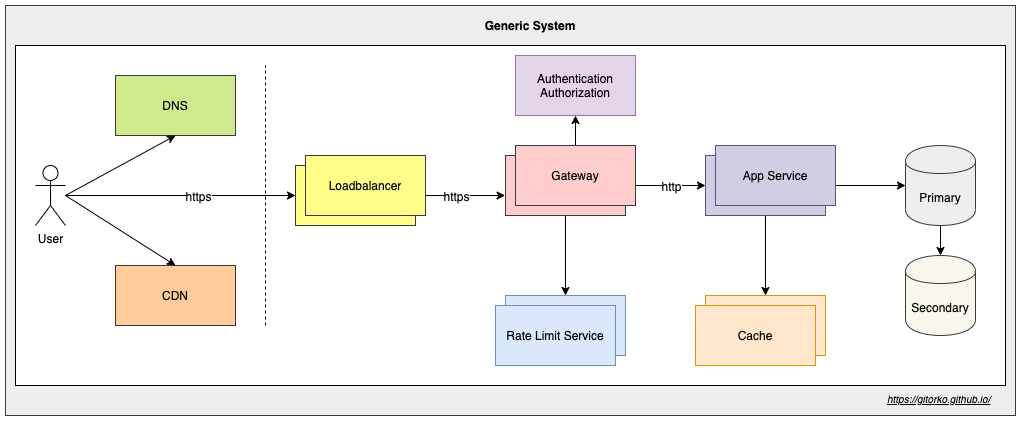
Distributed System
Blocking calls
Your service is not responding as there are some requests that are taking very long to complete. They are waiting on IO operations. What do you do?
Invoke this rest api that takes 60 secs to complete the job.
1for ((i=1;i<=10;i++));
2do
3  echo $i
4  curl --location 'http://localhost:8080/api/blocking-job/60' &
5done
6
7curl --location 'http://localhost:8080/api/time'
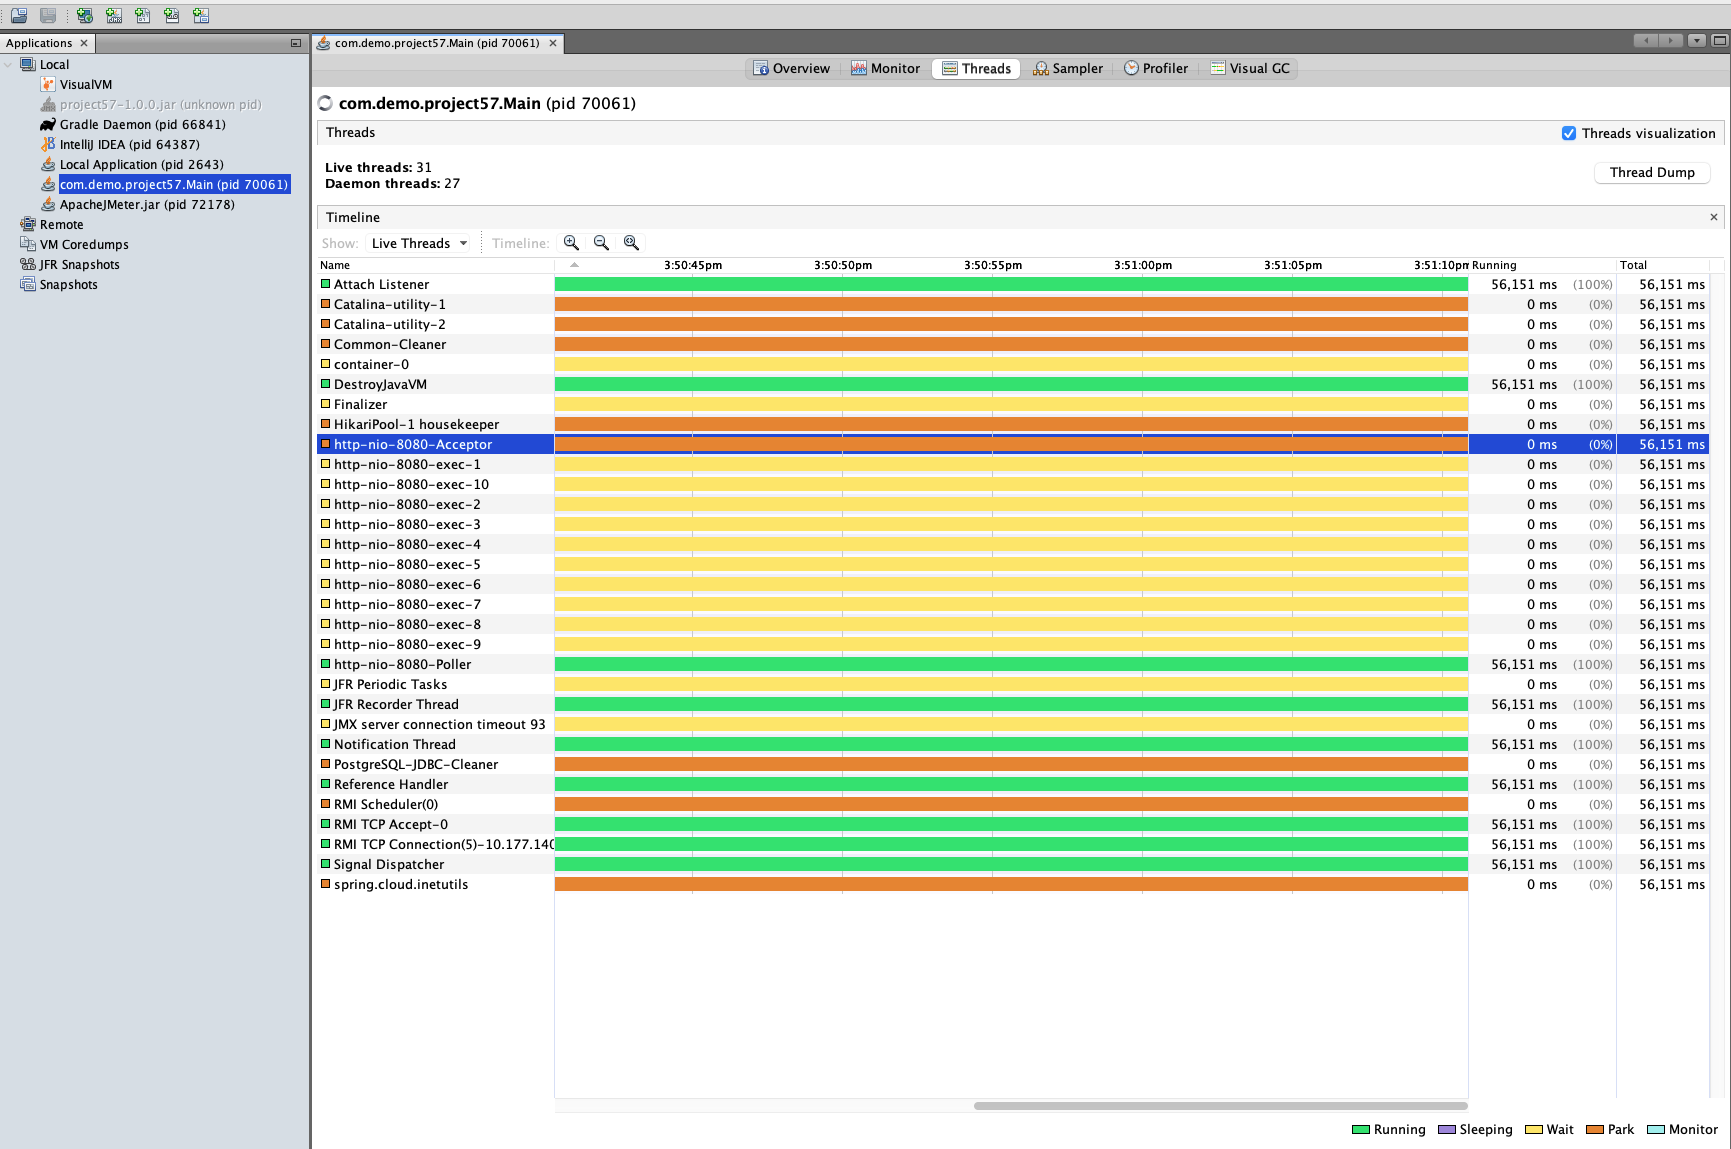
Determine if CPU intensive or IO intensive task and delegate the execution to a thread pool so that the core tomcat threads are free to serve requests. The default tomcat threads are 250 and any blocking that happens will affect the whole service.
There 2 types of protocol/connectors a tomcat server can be configured for
- BIO (Blocking IO) - The threads are not free till the response is sent back. (one thread per connection)
- NIO (Non-Blocking IO) - The threads are free to serve other requests while the incoming request is waiting for IO to complete. (more connections than threads)
In the BIO configuration, there are 2 types of threads
- Acceptors — To accept incoming requests and to add in a queue. Acceptors discard any request when the queue if full, default is 100.
- Workers — To pick requests from the acceptor queue and process each request in its own thread stack
Accept queue size
1server:
2  tomcat:
3    accept-count: 100
You will see the below error when the tomcat rejects the request due to queue being full
1Response code:Non HTTP response code: org.apache.http.conn.HttpHostConnectException
2Response message:Non HTTP response message: Connect to localhost:8080 [localhost/127.0.0.1, localhost/0:0:0:0:0:0:0:1] failed: Operation timed out
Invoke this rest api that takes 60 secs to complete the job but delegates the job to another thread.
1curl --location 'http://localhost:8080/api/async-job/60'
The below error is seen when the client has closed the connection but server is still processing the thread and tries to return a response on the connection.
1w.s.m.s.DefaultHandlerExceptionResolver : Resolved [org.springframework.web.context.request.async.AsyncRequestNotUsableException: ServletOutputStream failed to flush: ServletOutputStream failed to flush: java.io.IOException: Broken pipe]
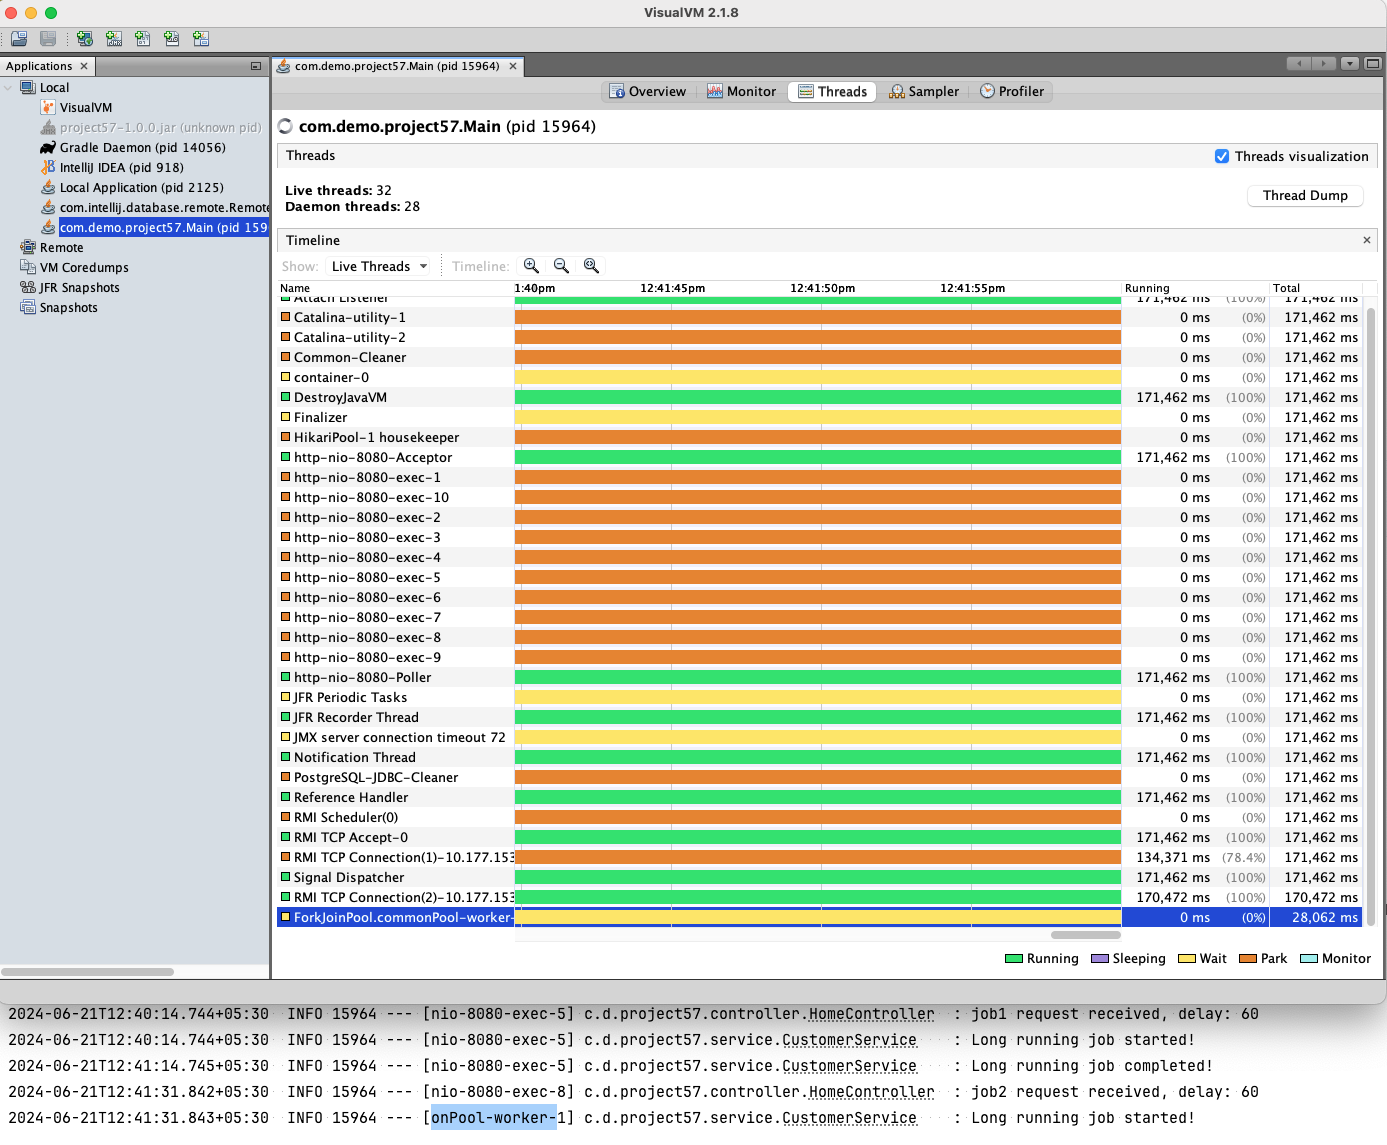
- Spring Reactor - Reactor is a non-blocking reactive programming model with back-pressure support, which supports NIO (non-blocking IO)
- Virtual Threads - Light-weight threads that were introduced in JDK21
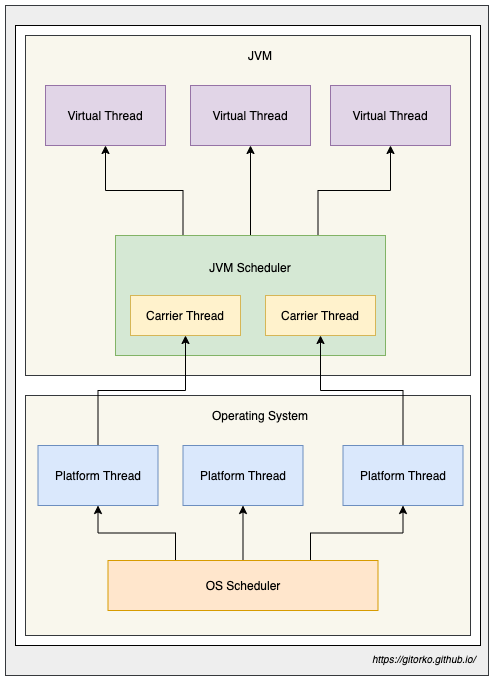
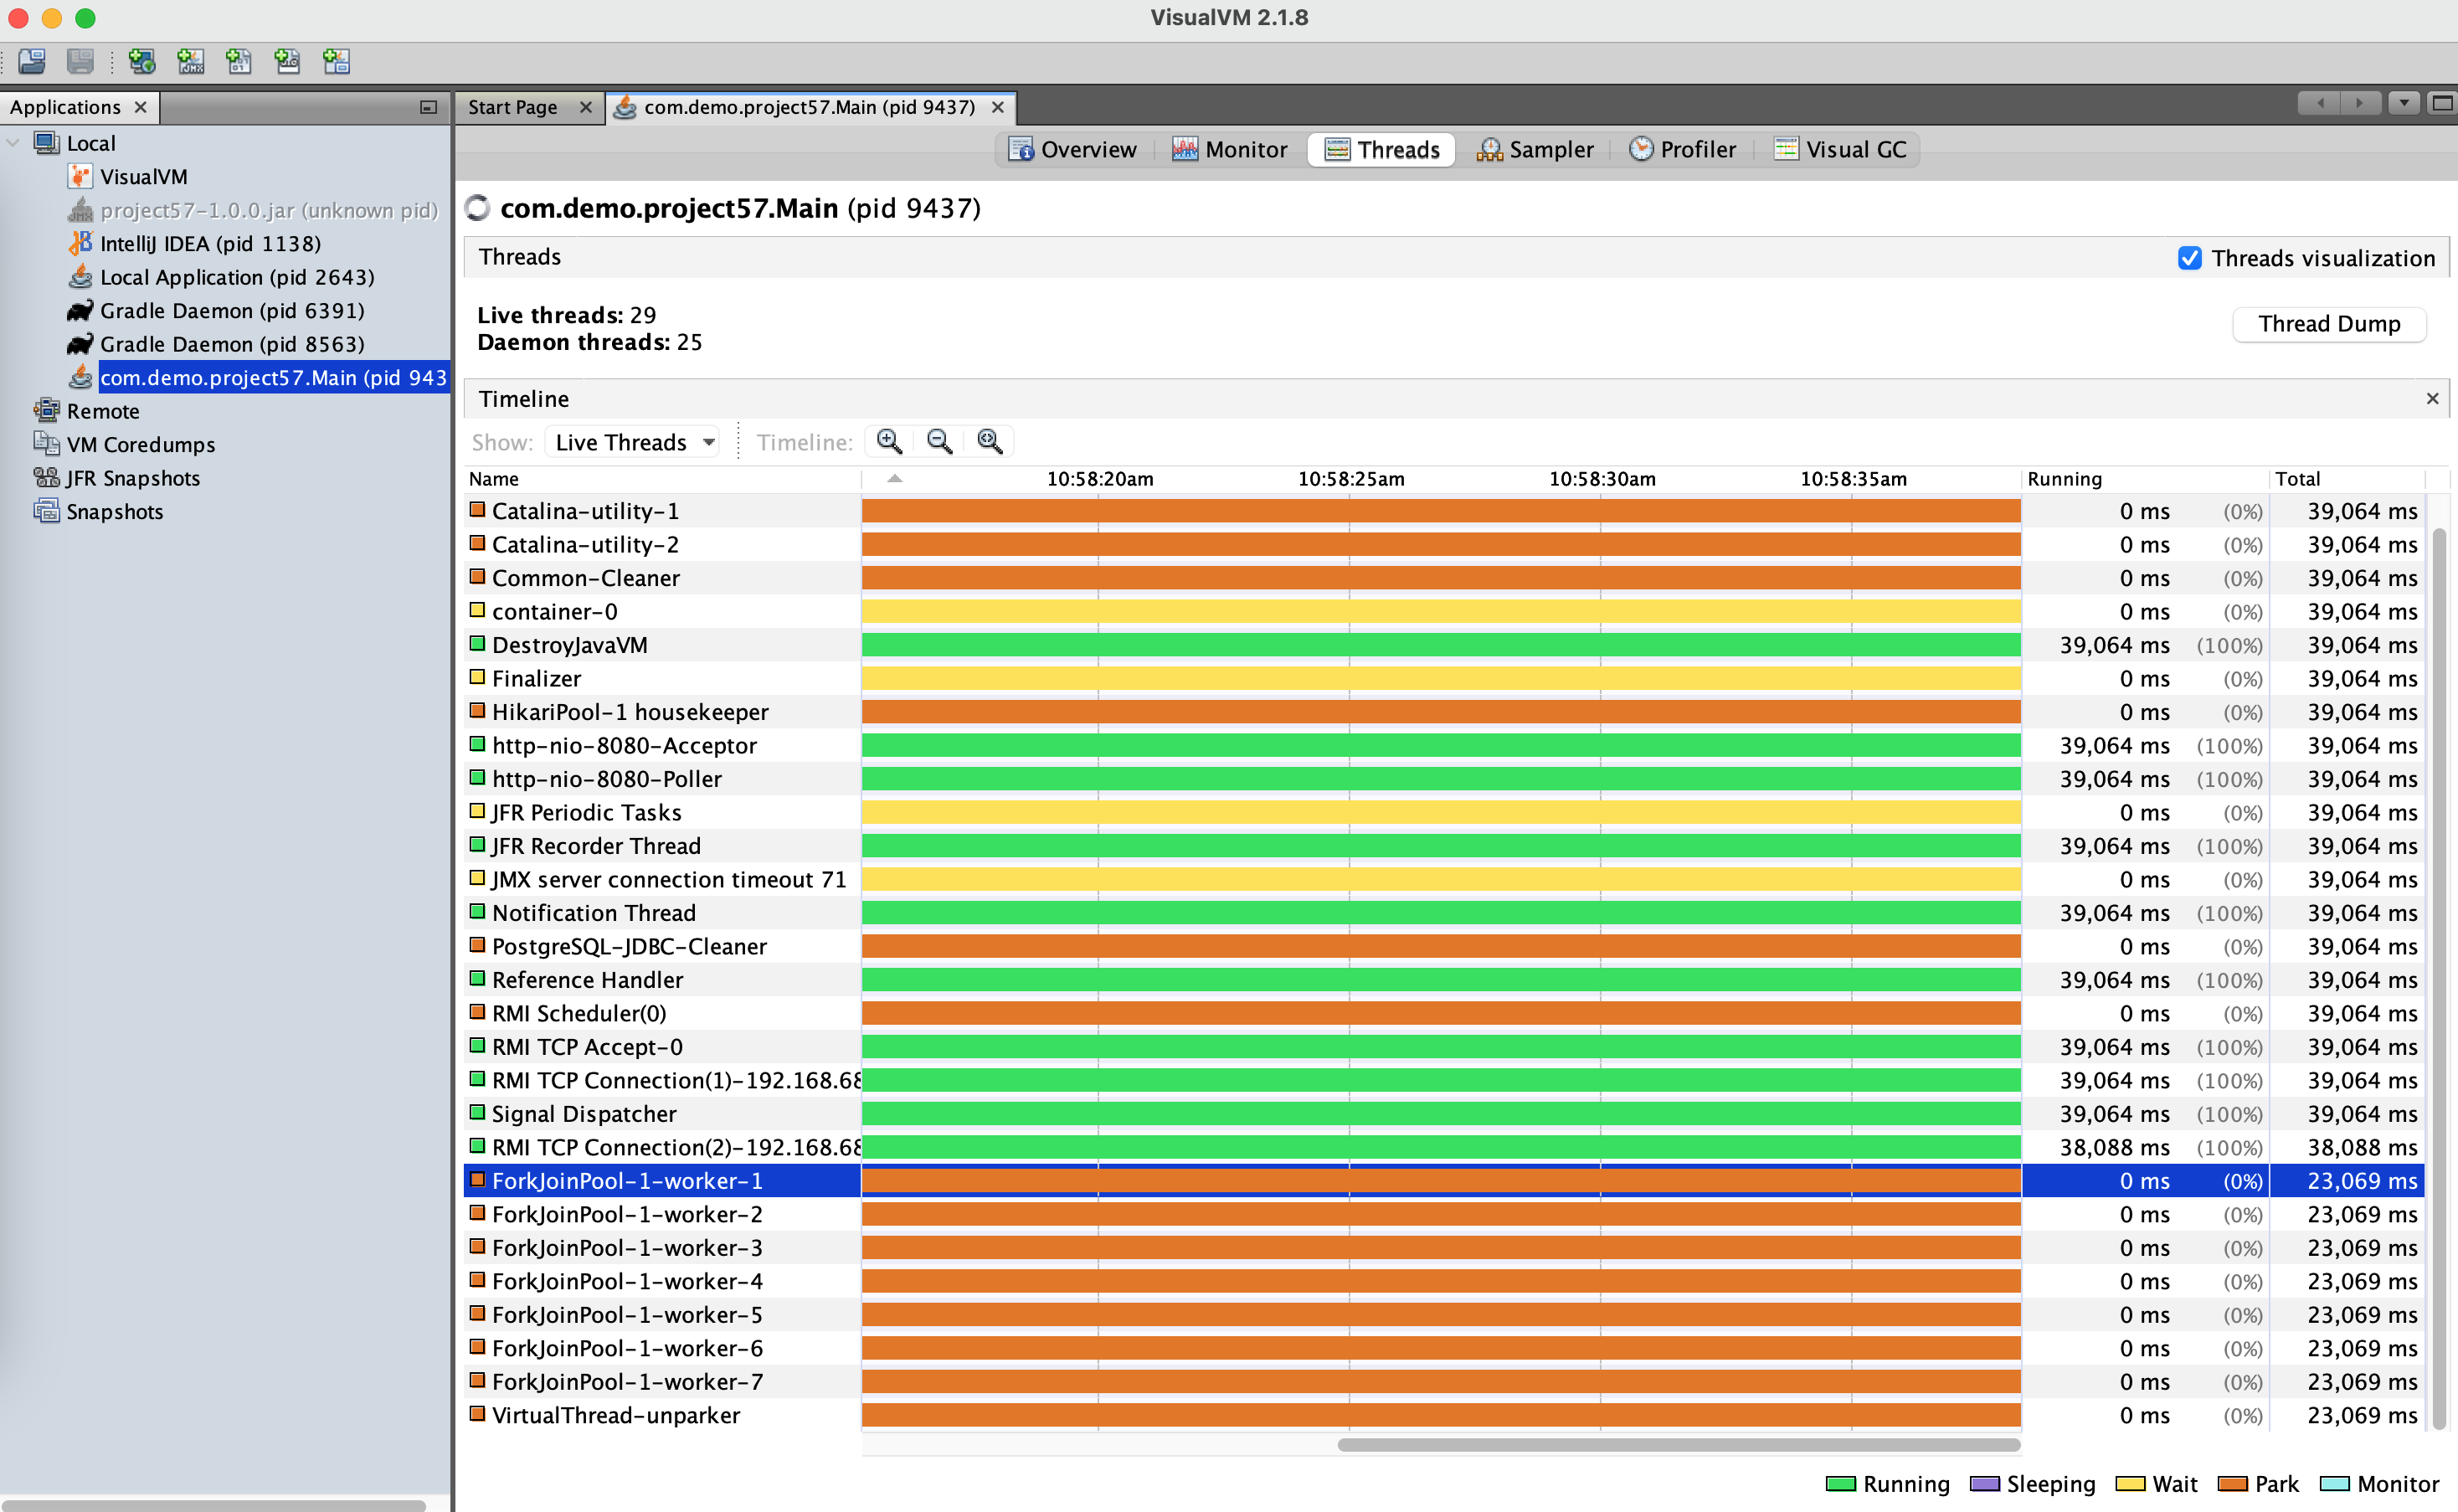
Virtual Threads
Virtual threads aim to improve the concurrency model in Java by introducing lightweight, user-mode threads that can efficiently handle a large number of concurrent tasks.
If your code calls a blocking I/O operation in a virtual thread, the runtime suspends the virtual thread until it can be resumed later. The hardware is utilized to an almost optimal level, resulting in high levels of concurrency and, therefore, high throughput.
Pitfalls to avoid in Virtual Threads
- Exceptions - Stack traces are separate, and any Exception thrown in a virtual thread only includes its own stack frames.
- Thread-local - Reduce usage as each thread will end up creating its own thread local unlike before where there are limited threads in pool, virtual threads can be many as they are cheap to create.
- Synchronized blocks/methods - When there is synchronized method or block used the virtual thread is pinned to a platform thread, it will not relinquish its control. This means it will hold the platform thread which can cause performance issues if there is IO happening inside the synchronized block. Use ReentrantLock instead of synchronized.
- Native code - When native code is used virtual threads get pinned to platform threads, it will not relinquish its control. This may be problematic if IO happens for longer time there by blocking/holding the platform thread.
- Thread pools - Avoid thread pool to limit resource access, eg: A thread pool of size 10 can create more than 10 concurrent threads due to virtual threads hence use semaphore if you want to limit concurrent requests based on pool size.
- Spring - In sprint context use
concurrency-limitto limit number of thread pool and avoid runway of virtual threads. - Performance - Platform threads are better when CPU intensive tasks are executed compared to virtual threads. Virtual threads benefit only when there is IO.
- Context switching - When virtual threads have blocking operation they yield and JVM moves the stack to heap memory. The stack is put back only when its time to execute the thread again. This is still cheaper than creating a new platform thread though.
 1Runnable fn = () -> {
 2  System.out.println("Running in thread: " + Thread.currentThread().getName());
 3};
 4
 5Thread.ofVirtual().name("virtual-thread-1").start(fn);
 6Thread.ofPlatform().name("platform-thread-1").start(fn);
 7
 8new Thread(fn, "platform-thread-2").start();
 9
10var executors = Executors.newVirtualThreadPerTaskExecutor();
11executors.submit(() -> {
12    System.out.println("Running in thread: " + Thread.currentThread().threadId());
13});
1spring.threads.virtual.enabled=true
Since the number of virtual threads created can be unlimited to ensure max concurrent requests use
1spring:
2  task:
3    execution:
4      simple:
5        concurrency-limit: 10
6    scheduling:
7      simple:
8        concurrency-limit: 10
Denial-of-Service (DOS) Attacks
Your server is receiving a lot of bad TCP connections. A bad downstream client is making bad tcp connections that doesn't do anything, valid users are getting Denial-of-Service. What do you do?
Create 10 telnet connections that connect to the tomcat server and then invoke the rest api to getTime which will not return anything as it will wait till the TCP connection is free.
1for ((i=1;i<=10;i++));
2do
3  echo $i
4  telnet 127.0.0.1 8080 &
5done
1curl --location 'http://localhost:8080/api/time'
The connection timeout means - If the client is not sending data after establishing the TCP handshake for 'N' seconds then close the connection. The default timeout is 2 minutes
1server.tomcat.connection-timeout=500
Many developers will assume that this connection timeout actually closes the connection when a long-running task takes more than 'N' seconds. This is not true. It only closes connection if the client doesn't send anything for 'N' seconds.
Time Limiter
A new team member has updated an API and introduced a bug and the function is very slow or never returns a response. System users are complaining of a slow system?
Always prefer fail-fast instead of a slow system fail-later. By failing fast the downstream consumers of your service can use circuit breaker pattern to handle the outages gracefully instead of dealing with a slow api.
If a function takes too long to complete it will block the tomcat thread which will further degrade the system performance. Use Resilience4j @TimeLimiter to explicitly timeout long running jobs, this way runaway functions cant impact your entire system.
Invoke this rest api that takes 10 secs to complete the job but timeout happens in 5 sec.
1curl --location 'http://localhost:8080/api/timeout-job/10'
You will see the error related to timeout
1java.util.concurrent.TimeoutException: TimeLimiter 'project57-tl' recorded a timeout exception.
2	at io.github.resilience4j.timelimiter.TimeLimiter.createdTimeoutExceptionWithName(TimeLimiter.java:225) ~[resilience4j-timelimiter-2.2.0.jar:2.2.0]
3	at io.github.resilience4j.timelimiter.internal.TimeLimiterImpl$Timeout.lambda$of$0(TimeLimiterImpl.java:185) ~[resilience4j-timelimiter-2.2.0.jar:2.2.0]
4	at java.base/java.util.concurrent.Executors$RunnableAdapter.call(Executors.java:572) ~[na:na]
5	at java.base/java.util.concurrent.FutureTask.run(FutureTask.java:317) ~[na:na]
6	at java.base/java.util.concurrent.ScheduledThreadPoolExecutor$ScheduledFutureTask.run(ScheduledThreadPoolExecutor.java:304) ~[na:na]
7	at java.base/java.util.concurrent.ThreadPoolExecutor.runWorker(ThreadPoolExecutor.java:1144) ~[na:na]
8	at java.base/java.util.concurrent.ThreadPoolExecutor$Worker.run(ThreadPoolExecutor.java:642) ~[na:na]
9	at java.base/java.lang.Thread.run(Thread.java:1583) ~[na:na]
Spring also uses spring.mvc.async.request-timeout that ensures REST APIs can timeout after the configurable amount of time. Default is 30 seconds.
1spring:
2  mvc:
3    async:
4      request-timeout: 30000
Always assume the functions/api will take forever and may never complete, design system accordingly by fencing the methods.
Request Thread Pool & Connections
During peak traffic users are reporting slow connection / timeout when connecting to your server? How many concurrent requests can your server handle?
The number of tomcat threads determine how many thread can handle the incoming requests. By default, this number is 200.
1# Applies for BIO
2server:
3  tomcat:
4    threads:
5      max: 10
6    max-connections: 10
Max number of connections the server can accept and process, for BIO (Blocking IO) tomcat the server.tomcat.threads.max is equal to server.tomcat.max-connections
You cant have more connections than the threads.
For NIO tomcat, the number of threads can be less and the max-connections can be more. Since the threads not blocked while waiting for IO to complete then can open up more connections and server other requests.
1# Applies only for NIO
2server:
3  tomcat:
4    threads:
5      max: 10
6    max-connections: 1000
Protocol limits the max connections per machine to 65,536, which is max ports available in TCP.
Throughput (requests served per second) of a single server depends on following
- Number of tomcat threads
- Server hardware (CPU, Memory, SSD, Network Bandwidth)
- Type of task (IO intensive vs CPU intensive)
If you have 200 threads (BIO) and all request response on average take 1 second (latency) to complete then your server can handle 200 requests per second. When there are IO intensive tasks which cause threads to wait and context switching takes place, throughput calculation becomes tricky and needs to be approximated.
Ideal number of threads that can be picked depend on
1                       Number of CPU Cores
2Number of Threads <= -----------------------
3                       1 - Blocking Factor
- For computation intensive job Blocking Factor (BF) is 0.
- For IO intensive job Blocking Factor (BF) is between 0 & 1 (0 < BF < 1)
- If BF is 0, for computation intensive job Number of threads == Number of CPU cores. If 4 core CPU then 4 threads.
- If BF is 0.9 then for 4 core CPU machine the threads allowed (10 * no of cores) are 40.
- If BF is 0.5 then for 4 core CPU machine the threads allowed (2 * no of cores) are 8.
Benchmark the system on a varied load to arrive at the peek throughput the system can handle.
Keep-Alive
Network admin calls you to tell that many TCP connections are being created to the same clients. What do you do?
TCP connections take time to be established, keep-alive keeps the connection alive for some more time incase the client want to send more data again in the new future.
1server:
2  tomcat:
3    max-keep-alive-requests: 10
4    keep-alive-timeout: 10
max-keep-alive-requests- Max number of HTTP requests that can be pipelined before connection is closed.keep-alive-timeout- Keeps the TCP connection for sometime to avoid doing a handshake again if request from same client is sent.
Rest Client Connection Timeout
You are invoking rest calls to an external service which has degraded and has become very slow there by causing your service to slow down. What do you do?
If the server makes external calls ensure to set the read and connection timeout on the rest client. If you dont set this then your server which is a client will wait forever to get the response.
1# If unable to connect the external server then give up after 5 seconds.
2setConnectTimeout(5_000);
3# If unable to read data from external api call then give up after 5 seconds.
4setReadTimeout(5_000);
Invoke this rest api that takes 10 secs as the external api is slow to complete the job but timeout happens in 5 sec.
1curl --location 'http://localhost:8080/api/external-api-job/10'
You will see below error when timeouts are set
12024-06-21T16:01:06.880+05:30 ERROR 25437 --- [nio-8080-exec-5] o.a.c.c.C.[.[.[/].[dispatcherServlet]    : Servlet.service() for servlet [dispatcherServlet] in context with path [] threw exception [Request processing failed: org.springframework.web.client.ResourceAccessException: I/O error on GET request for "http://jsonplaceholder.typicode.com/users/1": Read timed out] with root cause
2java.net.SocketTimeoutException: Read timed out
3	at java.base/sun.nio.ch.NioSocketImpl.timedRead(NioSocketImpl.java:278) ~[na:na]
4	at java.base/sun.nio.ch.NioSocketImpl.implRead(NioSocketImpl.java:304) ~[na:na]
5	at java.base/sun.nio.ch.NioSocketImpl.read(NioSocketImpl.java:346) ~[na:na]
If you are using WebClient then use Mono.timeout() or Flux.timeout() methods
Always assume that all external API calls never return and design accordingly.
Database Connection Pool
You are noticing database connection timeout. What do you do?
Use a connection pool if you are interacting with database as it will prevent the connection from getting open & closed which is a costly operation. The connection in the pool will be reused. Optimal size of connection pool is recommended, too big a pool is bad as there is a lot of context switching. The database also defines max connections allowed per application.
Spring boot provides Hikari connection pool. If there are run away SQL connections then service can quickly run out of connection in the pool and slow down the entire system.
1spring:
2  datasource:
3    hikari:
4      maximumPoolSize: 5
5      connectionTimeout: 1000
6      idleTimeout: 60
7      maxLifetime: 180
By setting the connectionTimeout we ensure that when the connection pool is full then we timeout after 1 second instead of waiting forever to get a new connection.
Fail-Fast is always preferred than slowing down the entire service.
Invoke this rest api that creates 10 new threads that request for DB connection while the pool only has 5.
1curl --location 'http://localhost:8080/api/async-db-job/10'
You will see the below error
 1Caused by: org.hibernate.exception.JDBCConnectionException: Unable to acquire JDBC Connection [HikariPool-1 - Connection is not available, request timed out after 1001ms (total=5, active=5, idle=0, waiting=0)] [n/a]
 2	at org.hibernate.exception.internal.SQLExceptionTypeDelegate.convert(SQLExceptionTypeDelegate.java:51) ~[hibernate-core-6.5.2.Final.jar:6.5.2.Final]
 3	at org.hibernate.exception.internal.StandardSQLExceptionConverter.convert(StandardSQLExceptionConverter.java:58) ~[hibernate-core-6.5.2.Final.jar:6.5.2.Final]
 4	at org.hibernate.engine.jdbc.spi.SqlExceptionHelper.convert(SqlExceptionHelper.java:108) ~[hibernate-core-6.5.2.Final.jar:6.5.2.Final]
 5	at org.hibernate.engine.jdbc.spi.SqlExceptionHelper.convert(SqlExceptionHelper.java:94) ~[hibernate-core-6.5.2.Final.jar:6.5.2.Final]
 6	at org.hibernate.resource.jdbc.internal.LogicalConnectionManagedImpl.acquireConnectionIfNeeded(LogicalConnectionManagedImpl.java:116) ~[hibernate-core-6.5.2.Final.jar:6.5.2.Final]
 7	at org.hibernate.resource.jdbc.internal.LogicalConnectionManagedImpl.getPhysicalConnection(LogicalConnectionManagedImpl.java:143) ~[hibernate-core-6.5.2.Final.jar:6.5.2.Final]
 8	at org.hibernate.resource.jdbc.internal.LogicalConnectionManagedImpl.getConnectionForTransactionManagement(LogicalConnectionManagedImpl.java:273) ~[hibernate-core-6.5.2.Final.jar:6.5.2.Final]
 9	at org.hibernate.resource.jdbc.internal.LogicalConnectionManagedImpl.begin(LogicalConnectionManagedImpl.java:281) ~[hibernate-core-6.5.2.Final.jar:6.5.2.Final]
10	at org.hibernate.resource.transaction.backend.jdbc.internal.JdbcResourceLocalTransactionCoordinatorImpl$TransactionDriverControlImpl.begin(JdbcResourceLocalTransactionCoordinatorImpl.java:232) ~[hibernate-core-6.5.2.Final.jar:6.5.2.Final]
11	at org.hibernate.engine.transaction.internal.TransactionImpl.begin(TransactionImpl.java:83) ~[hibernate-core-6.5.2.Final.jar:6.5.2.Final]
12	at org.springframework.orm.jpa.vendor.HibernateJpaDialect.beginTransaction(HibernateJpaDialect.java:176) ~[spring-orm-6.1.8.jar:6.1.8]
13	at org.springframework.orm.jpa.JpaTransactionManager.doBegin(JpaTransactionManager.java:420) ~[spring-orm-6.1.8.jar:6.1.8]
14	... 12 common frames omitted
15Caused by: java.sql.SQLTransientConnectionException: HikariPool-1 - Connection is not available, request timed out after 1001ms (total=5, active=5, idle=0, waiting=0)
16	at com.zaxxer.hikari.pool.HikariPool.createTimeoutException(HikariPool.java:686) ~[HikariCP-5.1.0.jar:na]
17	at com.zaxxer.hikari.pool.HikariPool.getConnection(HikariPool.java:179) ~[HikariCP-5.1.0.jar:na]
18	at com.zaxxer.hikari.pool.HikariPool.getConnection(HikariPool.java:144) ~[HikariCP-5.1.0.jar:na]
The configuration spring.hikari.connectionTimeout applies for new async thread pool.
However, the tomcat thread pool will always wait in blocking state to get a connection from the pool.
Invoke this rest api that runs 10 long-running db query job but will not timeout and wait in blocking state.
1ab -n 10 -c 10 http://localhost:8080/api/db-long-query-job/5
JPA also enables first level cache by default inside a transactions/session. After transaction is done the entity is garbage collected. For cache across sessions use second level cache.
Always assume that you will run out of database connections due to a bad api and set connection timeout for both the connection pool and thread pool to prevent them from waiting forever to get connections.
Long-Running Database Query
DBA call you up and informs you that there is a long-running query in your service. What do you do?
Long-running queries often slow down the entire system.
To check if there are long-running queries.
1select * from pg_stat_activity
To test this we explicitly slow down a query with pg_sleep function.
We set timeout on the transaction @Transactional(timeout = 5) to ensure that long-running query doesn't impact the entire system, after 5 seconds if the query doesn't return result an exception is thrown.
Fail-Fast is always preferred than slowing down the entire service.
12024-06-21T16:24:08.130+05:30  WARN 27713 --- [nio-8080-exec-2] o.h.engine.jdbc.spi.SqlExceptionHelper   : SQL Error: 0, SQLState: 57014
22024-06-21T16:24:08.130+05:30 ERROR 27713 --- [nio-8080-exec-2] o.h.engine.jdbc.spi.SqlExceptionHelper   : ERROR: canceling statement due to user request
32024-06-21T16:24:08.138+05:30 ERROR 27713 --- [nio-8080-exec-2] o.a.c.c.C.[.[.[/].[dispatcherServlet]    : Servlet.service() for servlet [dispatcherServlet] in context with path [] threw exception [Request processing failed: org.springframework.dao.QueryTimeoutException: JDBC exception executing SQL [select count(*), pg_sleep(?) IS NULL from customer] [ERROR: canceling statement due to user request] [n/a]; SQL [n/a]] with root cause
4
5org.postgresql.util.PSQLException: ERROR: canceling statement due to user request
6	at org.postgresql.core.v3.QueryExecutorImpl.receiveErrorResponse(QueryExecutorImpl.java:2725) ~[postgresql-42.7.3.jar:42.7.3]
7	at org.postgresql.core.v3.QueryExecutorImpl.processResults(QueryExecutorImpl.java:2412) ~[postgresql-42.7.3.jar:42.7.3]
Always assume that all DB calls never return or are long-running and design accordingly.
You can further look at optimizing the query with help of indexes to avoid full table scan or introducing caching.
You can enable show-sql to view all the db queries however this will print to console without logging framework hence not recommended
1spring:
2  jpa:
3    show-sql: true
To pretty print SQL
1spring:
2  jpa:
3    properties:
4      hibernate:
5        show_sql: true
6        format_sql: true
To print the SQL in logging framework use
1logging:
2  level:
3    root: info
4    org.hibernate.SQL: DEBUG
5    org.hibernate.type.descriptor.sql.BasicBinder: TRACE
6    org.hibernate.orm.jdbc.bind: TRACE
Indexing
You tested your code for data fetch via SQL on dev setup ensuring that indexes were created and used. But in production the indexes are not being used despite being present, this is slowing your service. What do you do?
Creating an index doesn't garuntee that the SQL execution engine will use those indexes. The optimizer might choose a full table scan over an index if it determines that it is optimal.
1EXPLAIN (FORMAT JSON) select * from customer where city = 'San Jose';
2EXPLAIN (FORMAT JSON, ANALYSE) select * from customer where city = 'San Jose';
Without Index
 1[
 2  {
 3    "Plan": {
 4      "Node Type": "Seq Scan",
 5      "Parallel Aware": false,
 6      "Async Capable": false,
 7      "Relation Name": "customer",
 8      "Alias": "customer",
 9      "Startup Cost": 0.00,
10      "Total Cost": 2.40,
11      "Plan Rows": 1,
12      "Plan Width": 39,
13      "Actual Startup Time": 0.034,
14      "Actual Total Time": 0.044,
15      "Actual Rows": 1,
16      "Actual Loops": 1,
17      "Filter": "((city)::text = 'San Jose'::text)",
18      "Rows Removed by Filter": 111
19    },
20    "Planning Time": 0.149,
21    "Triggers": [
22    ],
23    "Execution Time": 0.078
24  }
25]
With Index
 1[
 2  {
 3    "Plan": {
 4      "Node Type": "Index Scan",
 5      "Parallel Aware": false,
 6      "Async Capable": false,
 7      "Scan Direction": "Forward",
 8      "Index Name": "idx_customer_city",
 9      "Relation Name": "customer",
10      "Alias": "customer",
11      "Startup Cost": 0.14,
12      "Total Cost": 8.16,
13      "Plan Rows": 1,
14      "Plan Width": 1556,
15      "Actual Startup Time": 0.031,
16      "Actual Total Time": 0.033,
17      "Actual Rows": 1,
18      "Actual Loops": 1,
19      "Index Cond": "((city)::text = 'San Jose'::text)",
20      "Rows Removed by Index Recheck": 0
21    },
22    "Planning Time": 0.380,
23    "Triggers": [
24    ],
25    "Execution Time": 0.090
26  }
27]
- Index Scan: This indicates that the query is using the index. The output will mention the specific index name.
- Seq Scan: This indicates a sequential scan, meaning the index is not being used.
EXPLAIN ANALYZE: To see actual execution statistics rather than just an estimation, you can use EXPLAIN ANALYZE, which will run the query and provide runtime details.
- If the table is small, and a full table scan is faster than using the index.
- A significant portion of the table matches the condition, making an index scan less efficient.
- If there are many rows with the same city value, the optimizer might prefer a sequential scan.
- Index occupies space and impacts insert and delete row performance.
- If there are 2 indexes then its upto the optimizer to pick the one it finds a best fit. Behaviour might change at runtime.
- Order in which the where clause is written will impact which index is used. The index column should be the first in the where clause and any other filtering logic should come after index columns.
- Always ensure that the where clause contains the same columns that are indexed.
You can also use hints to ensure that optimizer chooses to use the indexes. To provide hints enable the extension
1CREATE EXTENSION pg_hint_plan;
Insert 100k records
1INSERT INTO  public.customer (city, name, phone)
2SELECT
3    'city_' || gs,
4    'name_' || gen_random_uuid(),
5    'phone_' || gs
6FROM generate_series(1, 5000000) AS gs;
You can only provide a hint, there are no guarantee that optimizer will use those hints.
1EXPLAIN (FORMAT JSON) /*+ IndexScan(customer idx_customer_city) */
2SELECT * FROM public.customer WHERE city = 'San Jose';
3
4EXPLAIN (FORMAT JSON) /*+ IndexScan(customer idx_customer_city NO) */
5SELECT * FROM public.customer WHERE city = 'San Jose';
Check index
1SELECT * FROM pg_indexes WHERE indexname = 'idx_customer_city';
2SELECT indexname, indexdef FROM pg_indexes WHERE tablename = 'customer';
Database Schema Changes
You add a SQL change to modify an existing table schema or add a new index. The table already exists in production with 10 million rows. You test your change in QE environment which works fine but when your change hits production the database table gets locked for 30 minutes there by causing an outage. What do you do?
Changes to the schema of existing tables locks the table.
- Till the time the liquibase change is not applied the server will not start, this could mean that your server will take a long time to come online.
- Any other existing services that are still up and are reading from that table will also be blocked on either read/write.
This could mean a big down-time depending on the data size.
Insert some test data
1INSERT INTO customer (name, phone, city)
2SELECT
3    'Test-Name',
4    '999-999-9999',
5    'Test-City'
6FROM generate_series(1, 10000000);
7select count(*) from customer;
Adding column with default value
Since postgres 11 alter column with default value doesn't lock the table for read and write anymore as there is no table re-write. In older versions that table is entirely rewritten, so it's an expensive operation.
1--since postgres11 this doesnt matter.
2ALTER TABLE customer ADD COLUMN last_update TIMESTAMP DEFAULT now();
vs
1ALTER TABLE customer ADD COLUMN last_update TIMESTAMP;
2
3--This will take a long time, ensure that this happens in a different transaction and not part of alter table transaction.
4UPDATE customer SET last_update = now();
clean up
1ALTER TABLE customer DROP COLUMN last_update;
Lock queues & Lock timeouts
Postgres uses lock queues. Transactions that modify a same row/table are queued, they remain blocked till they are executed in the order they were queued.
Use lock timeout to set max limit to wait for operation. By setting lock_timeout, the DDL command will fail if it ends up waiting for a lock more than 5 seconds The downside is that your ALTER TABLE might not succeed, but you can try again later. Check pg_stat_activity to see if there are long-running queries before starting the DDL command.
1SET lock_timeout TO '5s';
2ALTER TABLE customer ADD COLUMN last_update TIMESTAMP;
To look at the locks
1select * from pg_locks;
clean up
1ALTER TABLE customer DROP COLUMN last_update;
Creating/dropping indexes concurrently
Creating an index on a large table can take long time. This can affect the startup times of your service.
The create index command blocks all writes for the duration of the command. It doesn't block select it blocks only insert & delete.
The create index concurrently is a better approach.
Creating an index concurrently does have a downside. If something goes wrong it does not roll back and leaves an unfinished ("invalid") index behind.
If that happens, run drop index concurrently name_index and try to create it again.
1CREATE INDEX name_index ON customer (name);
vs
1CREATE INDEX CONCURRENTLY name_index ON customer (name);
clean up
1DROP INDEX CONCURRENTLY name_index;
Altering an indexed column & adding not null column
Altering a column that already has index is a costly operation. If not null columns are added it's a 2 step operation where you add the column and then add a default value.
Truncate vs Delete
Prefer truncate over delete to clean a table. Truncate doesn't write to transactional log hence is faster but there is no option of rollback. Both block read & modify operations. Truncate quickly remove all rows from a table and do not need to worry about triggers, foreign key constraints, or retaining identity column values. Delete removes specific rows, rely on triggers, enforce foreign key constraints, or need the operation to be fully logged.
1delete from customer;
vs
1truncate table customer;
Modifying Large Data Set
Another approach of making changes to big tables and have them lock the table is by copying the data to a new table and then renaming it after the operation is completed.
The below SQL will block all reads on the table till the transaction is completed.
1BEGIN;
2ALTER TABLE customer ADD COLUMN age INTEGER;
3
4--This will take a long time, instead of DEFAULT we can refer to some other table and populate age here.
5UPDATE customer SET age = (select 18);
6
7ALTER TABLE customer ALTER COLUMN age SET NOT NULL;
8COMMIT;
The below SQL will create a copy of the table and modify the data and then rename it. This means that reads are not blocked unlike the above SQL.
1BEGIN;
2CREATE TABLE customer_copy AS SELECT * FROM customer;
3ALTER TABLE customer_copy ADD COLUMN age INTEGER;
4--This will take a long time, instead of DEFAULT we can refer to some other table and populate age here.
5UPDATE customer_copy SET age = (select 18);
6ALTER TABLE customer_copy ALTER COLUMN age SET NOT NULL;
7DROP TABLE customer;
8ALTER TABLE customer_copy RENAME TO customer;
9COMMIT;
clean up
1ALTER TABLE customer DROP COLUMN age;
Adding a primary key
If you are adding/modifying primary key then index creation take a long time.
You need to introduce an unqiue constraint concurrently CREATE UNIQUE INDEX CONCURRENTLY and then use the unique index as a primary key, which is a fast operation.
1--drop primary key for testing
2ALTER TABLE customer DROP CONSTRAINT customer_pkey;
1-- blocks queries for a long time
2ALTER TABLE customer ADD PRIMARY KEY (id);
1-- takes a long time, but doesn't block queries
2CREATE UNIQUE INDEX CONCURRENTLY customer_unq ON customer (id);
3-- blocks queries, but only very briefly
4ALTER TABLE customer ADD CONSTRAINT customer_pkey PRIMARY KEY USING INDEX customer_unq;
Locking in Database
- Table level locks
- Row level locks
Transactions run concurrently until they try to acquire a conflicting lock like updating the same row. The first transaction to acquire the lock can proceed, and the second one waits until the first transaction commits or aborts. Locks are always kept until commit or rollback.
There are 2 types of locks
- Shared lock (FOR SHARE)
- Exclusive lock (FOR UPDATE)
Below query acquires a row lock that prevent any modification to the selected row.
1--other transactions can still read the same row but cant modify it.
2SELECT * from customer where id = 1 FOR SHARE;
1--other transactions cant even read/modify the same row
2SELECT * from customer where id = 1 FOR UPDATE;
Never VACUUM FULL
The AUTOVACUUM is a background process that automatically performs vacuuming which helps manage and optimize the storage of data within the database.
- Reclaims Storage
- Prevents Transaction ID Wraparound
- Updates Statistics
- Maintains Indexes
To optimize PostgreSQL performance, you need to adjust autovacuum settings and effectively use indexes
Running VACUUM (but not VACUUM FULL) periodically can help maintain database health.
Database rollback
The database schema must be compatible with the previous version to ensure that application rollback doesn't require database rollback. Database rollback should be avoided as much as possible.
Memory Leak & CPU Spike
You tested your service on your laptop and local kubernetes instance. In production the admin informs you that your pods are restarting frequently. What do you do?
Memory leaks are always hard to debug, a badly written method can cause spike in heap memory usage causing lot of GC (garbage collection) which are stop of the world events.
With kubernetes you can define resource limits that kill the pod if tries to use more resources than allocated. Limit define the limits for the container, requests define limit for single container as there can be multiple containers in single pod.
1resources:
2    requests:
3      cpu: "250m"
4      memory: "250Mi"
5    limits:
6      cpu: "2"
7      memory: "500Mi"
Invoke this rest api that creates a memory leak in the jvm.
1curl --location 'http://localhost:8080/api/memory-leak-job/999'
This causes a memory spike, the pod will be killed (OOMKilled) and a new pod brought up.
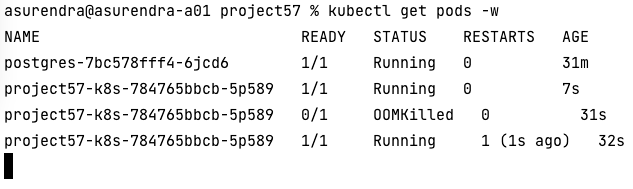
For an OutOfMemoryError the pod doesn't necessarily kill the pod unless some health check is configured. Pod will still remain in running state despite the OOM error. Only the resource limits defined determine when the pod gets killed.
1Exception in thread "http-nio-8080-exec-1" java.lang.OutOfMemoryError: Java heap space
Response Payload Size
Your rest api returns list of customer records, However as more customers are added in production the size of response becomes bigger & bigger and slows down the request-response times.
1curl --location 'http://localhost:8080/api/customer'
Always add pagination support and avoid returning all the data in a single response. Data may grow later causing response size to get bigger over a period of time.
1curl --location 'http://localhost:8080/api/customer-page'
Enable gzip compression which also reduce the size of response payload.
1server:
2  compression:
3    enabled: true
4    # Minimum response when compression will kick in
5    min-response-size: 512
6    # Mime types that should be compressed
7    mime-types: text/xml, text/plain, application/json
You can also consider using GraphQL so that client can request for only the data it needs
You can also change the protocol to http2 to get more benefits like multiplexing many requests over single tcp connection.
1server:
2  http2:
3    enabled: true
HTTP caching - You can also avoid sending response if the payload hasn't changed since last modified time.
If the response contains Last-Modified or ETag the client can re-use the previous payload as nothing has changed.
Last-Modified
Client will send the last modified If-Modified-Since header field and if payload hasnt changed server will return 304 Not Modified
Etag
- Shallow Hashing - Client sends the previous ETag and server generates the whole payload and then create a ETag and matches if it is same. If yes then return 304 Not Modified.
- Deep Hashing - Client sends previous Etag and server compares it against the latest ETag it holds in cache. If same then returns 304 Not Modified
Always try to reduce the size of the response payload, send only the data required instead of the whole payload. Use pagination for data records and gzip payload to reduce the size.
If there is an api being called every second then it makes sends to either use Web Sockets or Server Send Events (SSE) which can stream data and avoid the costly request-response.
API versioning & Feature Flag
A new team member has updated an existing API & introduced a new feature that was used by many downstream applications, however a bug got introduced and now all the downstream api are failing.
Always look at versioning your api instead of updating existing api that are used by downstream services. This contains the blast radius of any bug.
eg: /api/v1/customers being the old api and /api/v2/customers being the new api
Use feature flag that can be toggled on/off if any issues arise.
1management:
2  endpoint:
3    refresh:
4      enabled: true
Backward compatibility is very important, specially when services rollback to older versions in distributed systems. Always work with versioned API or feature flag if there are major changes or new features being introduced.
Bulk Head Pattern
Thread pools are shared, a runway function is occupying the thread pool 100% and not letting other tasks execute. What do you do?
Bulkhead defines maximum number of concurrent calls allowed to be executed in a given timeframe. This prevents failures in a system/API from affecting other systems/APIs

The @Bulkhead is the annotation used to enable bulkhead on an API call. This can be applied at the method level or a class level. If applied at the class level, it applies to all public methods.
1resilience4j:
2  bulkhead:
3    instances:
4      project57-b1:
5        max-concurrent-calls: 2
6        max-wait-duration: 10ms
max-concurrent-calls- Number of concurrent calls allowedmax-wait-duration- Wait for 10ms before failing in case of the limit breach
1ab -n 10 -c 10 http://localhost:8080/api/bulk-head-job
1Complete requests:      10
2Failed requests:        7
3   (Connect: 0, Receive: 0, Length: 7, Exceptions: 0)
4Non-2xx responses:      7
Rate Limit vs Bulk Head
- rate-limit - Allow this api to run only 10 requests per min.
- bulk-head - Allow this api to use only 10 threads from the pool per min to run. Rest of threads will be available for other API.
Rate Limiter
A particular api of your service is overused due to a wrong retry logic in a client which just keeps spamming your server on that single api.
Look at implementing rate limiting. Rate limiting can be implemented at gateway level or at application level. It helps prevent Denial of Service attacks.
For rate limiting implementation at gateway level refer
http://gitorko.github.io/post/spring-traefik-rate-limit
The @RateLimiter is the annotation used to rate-limit an API call and applied at the method or class levels. If applied at the class level, it applies to all public methods
1resilience4j:
2  ratelimiter:
3    instances:
4      project57-r1:
5        limit-for-period: 5
6        limit-refresh-period: 1s
7        timeout-duration: 0s
timeout-duration- default wait time a thread waits for a permissionlimit-refresh-period- time window to count the requestslimit-for-period- number of requests or method invocations are allowed in the above limit-refresh-period
1ab -n 10 -c 10 http://localhost:8080/api/rate-limit-job
1Complete requests:      10
2Failed requests:        5
Always assume that your api will be invoked by clients more than they are intended to be invoked due to wrong retry configuration.
Retry
One of the downstream service had a minor glitch (restart) and your rest call failed the first time it got a bad response. What do you do?
Rest calls often fail in distributed environment. You need to retry @Retry the api with exponential backoff and max attempts to avoid overwhelming the server.
Ensure that the external rest api being called in retry is idempotent.
 1resilience4j:
 2  retry:
 3    instances:
 4      project57-y1:
 5        max-attempts: 3
 6        waitDuration: 10s
 7        enableExponentialBackoff: true
 8        exponentialBackoffMultiplier: 2
 9        retryExceptions:
10          - org.springframework.web.client.HttpClientErrorException
11        ignoreExceptions:
12          - org.springframework.web.client.HttpServerErrorException
Invoke this rest api that fails the first 2 times and succeeds on the 3rd attempt.
1curl --location 'http://localhost:8080/api/retry-job'
Circuit Breaker Pattern
The circuit breaker pattern protects a downstream service by restricting the upstream service from calling the downstream service during a partial or complete downtime.
The @CircuitBreaker will close the circuit so that downstream client dont keep calling the same api again & again when it is having issues.
 1resilience4j:
 2  circuitbreaker:
 3    instances:
 4      project57-c1:
 5        failure-rate-threshold: 50
 6        minimum-number-of-calls: 5
 7        automatic-transition-from-open-to-half-open-enabled: true
 8        wait-duration-in-open-state: 5s
 9        permitted-number-of-calls-in-half-open-state: 3
10        sliding-window-size: 10
11        sliding-window-type: count_based
Invoke the below api to open and close the circuit. If more failures are seen circuit is opened which mean no traffic can flow.
A CircuitBreaker can be in three states:
CLOSED– API working fineOPEN– API experiencing issues, all requests to it are short-circuitedHALF_OPEN– API experiencing issues and some traffic will be allowed periodically to check if server recovered
In half open mode only few requests are allowed to check if service recovered. In closed state it will send 503 Service Unavailable error.
1curl --location 'http://localhost:8080/api/circuit-breaker-job/true'
1curl --location 'http://localhost:8080/api/circuit-breaker-job/false'
Health Check
Observability & Monitoring
Your customer reaches out each time there is an issue. Is there an active way to monitor your system instead of waiting for customer to report the issue? What do you do?
- Monitoring - ensures the system is healthy. You can monitor CPU usage, memory usage, request rates, and error rates.
- Observability - helps you understand issues and derive insights.
You can use active monitoring setup which will proactively look for issues that happen in your system so that you can address them.
Observability is the ability to observe the internal state of a running system from the outside. Observability has 3 pillars
- Logging - Logging Correlation IDs - Correlation IDs provide a helpful way to link lines in your log files to spans/traces.
- Metrics - Custom metrics to monitor time taken, count invocations etc.
- Distributed Tracing - Micrometer Tracing library is a facade for popular tracer libraries. eg: OpenTelemetry, OpenZipkin Brave
https://gitorko.github.io/post/spring-observability/
Exception Handling
You errors are returning 500 Internal Server error, downstream services are not able to determine reason for the error.
Use @RestControllerAdvice to return custom error responses.
If you have generic exception then use @Order to determine which exception gets returned first in a nested exception.
To get more details in the error response enable these
1server:
2  error:
3    include-binding-errors: always
4    include-exception: false
5    include-message: always
6    include-path: always
7    include-stacktrace: never
Be aware that if you are using dev tools org.springframework.boot:spring-boot-devtools the error response will be detailed by default and will not behave same in production unless the above properties are configured.
Logging
Kubernetes pods are ephemeral, you dont have access to history logs that are written to console.
- Enable file logging
- Enable rolling of log file
- Enable trace-id in log file
- Enable GC logging
- Enable async logging (does come with risk of loosing few log messages)
- Logs must contain pod name to determine which instance the error occurred on
- Log file name must contain pod name
File logging
 1logging:
 2  file:
 3    name: project57-app-${HOSTNAME}.log
 4  logback:
 5    rollingpolicy:
 6      file-name-pattern: logs/%d{yyyy-MM, aux}/project57-app-${HOSTNAME}.%d{yyyy-MM-dd}.%i.log
 7      max-file-size: 100MB
 8      total-size-cap: 10GB
 9      max-history: 10
10  level:
11    root: info
GC logging
1'-Xlog:gc*=info:file=logs/project57-gc.log:time,uptime,level,tags:filecount=5,filesize=100m',
On kubernetes write the log to a persistent volume else you will loose the logs on pod restart.
You can use FluentD or Promtail log brokers that collect and send logs to an Elasticsearch/Loki storage.
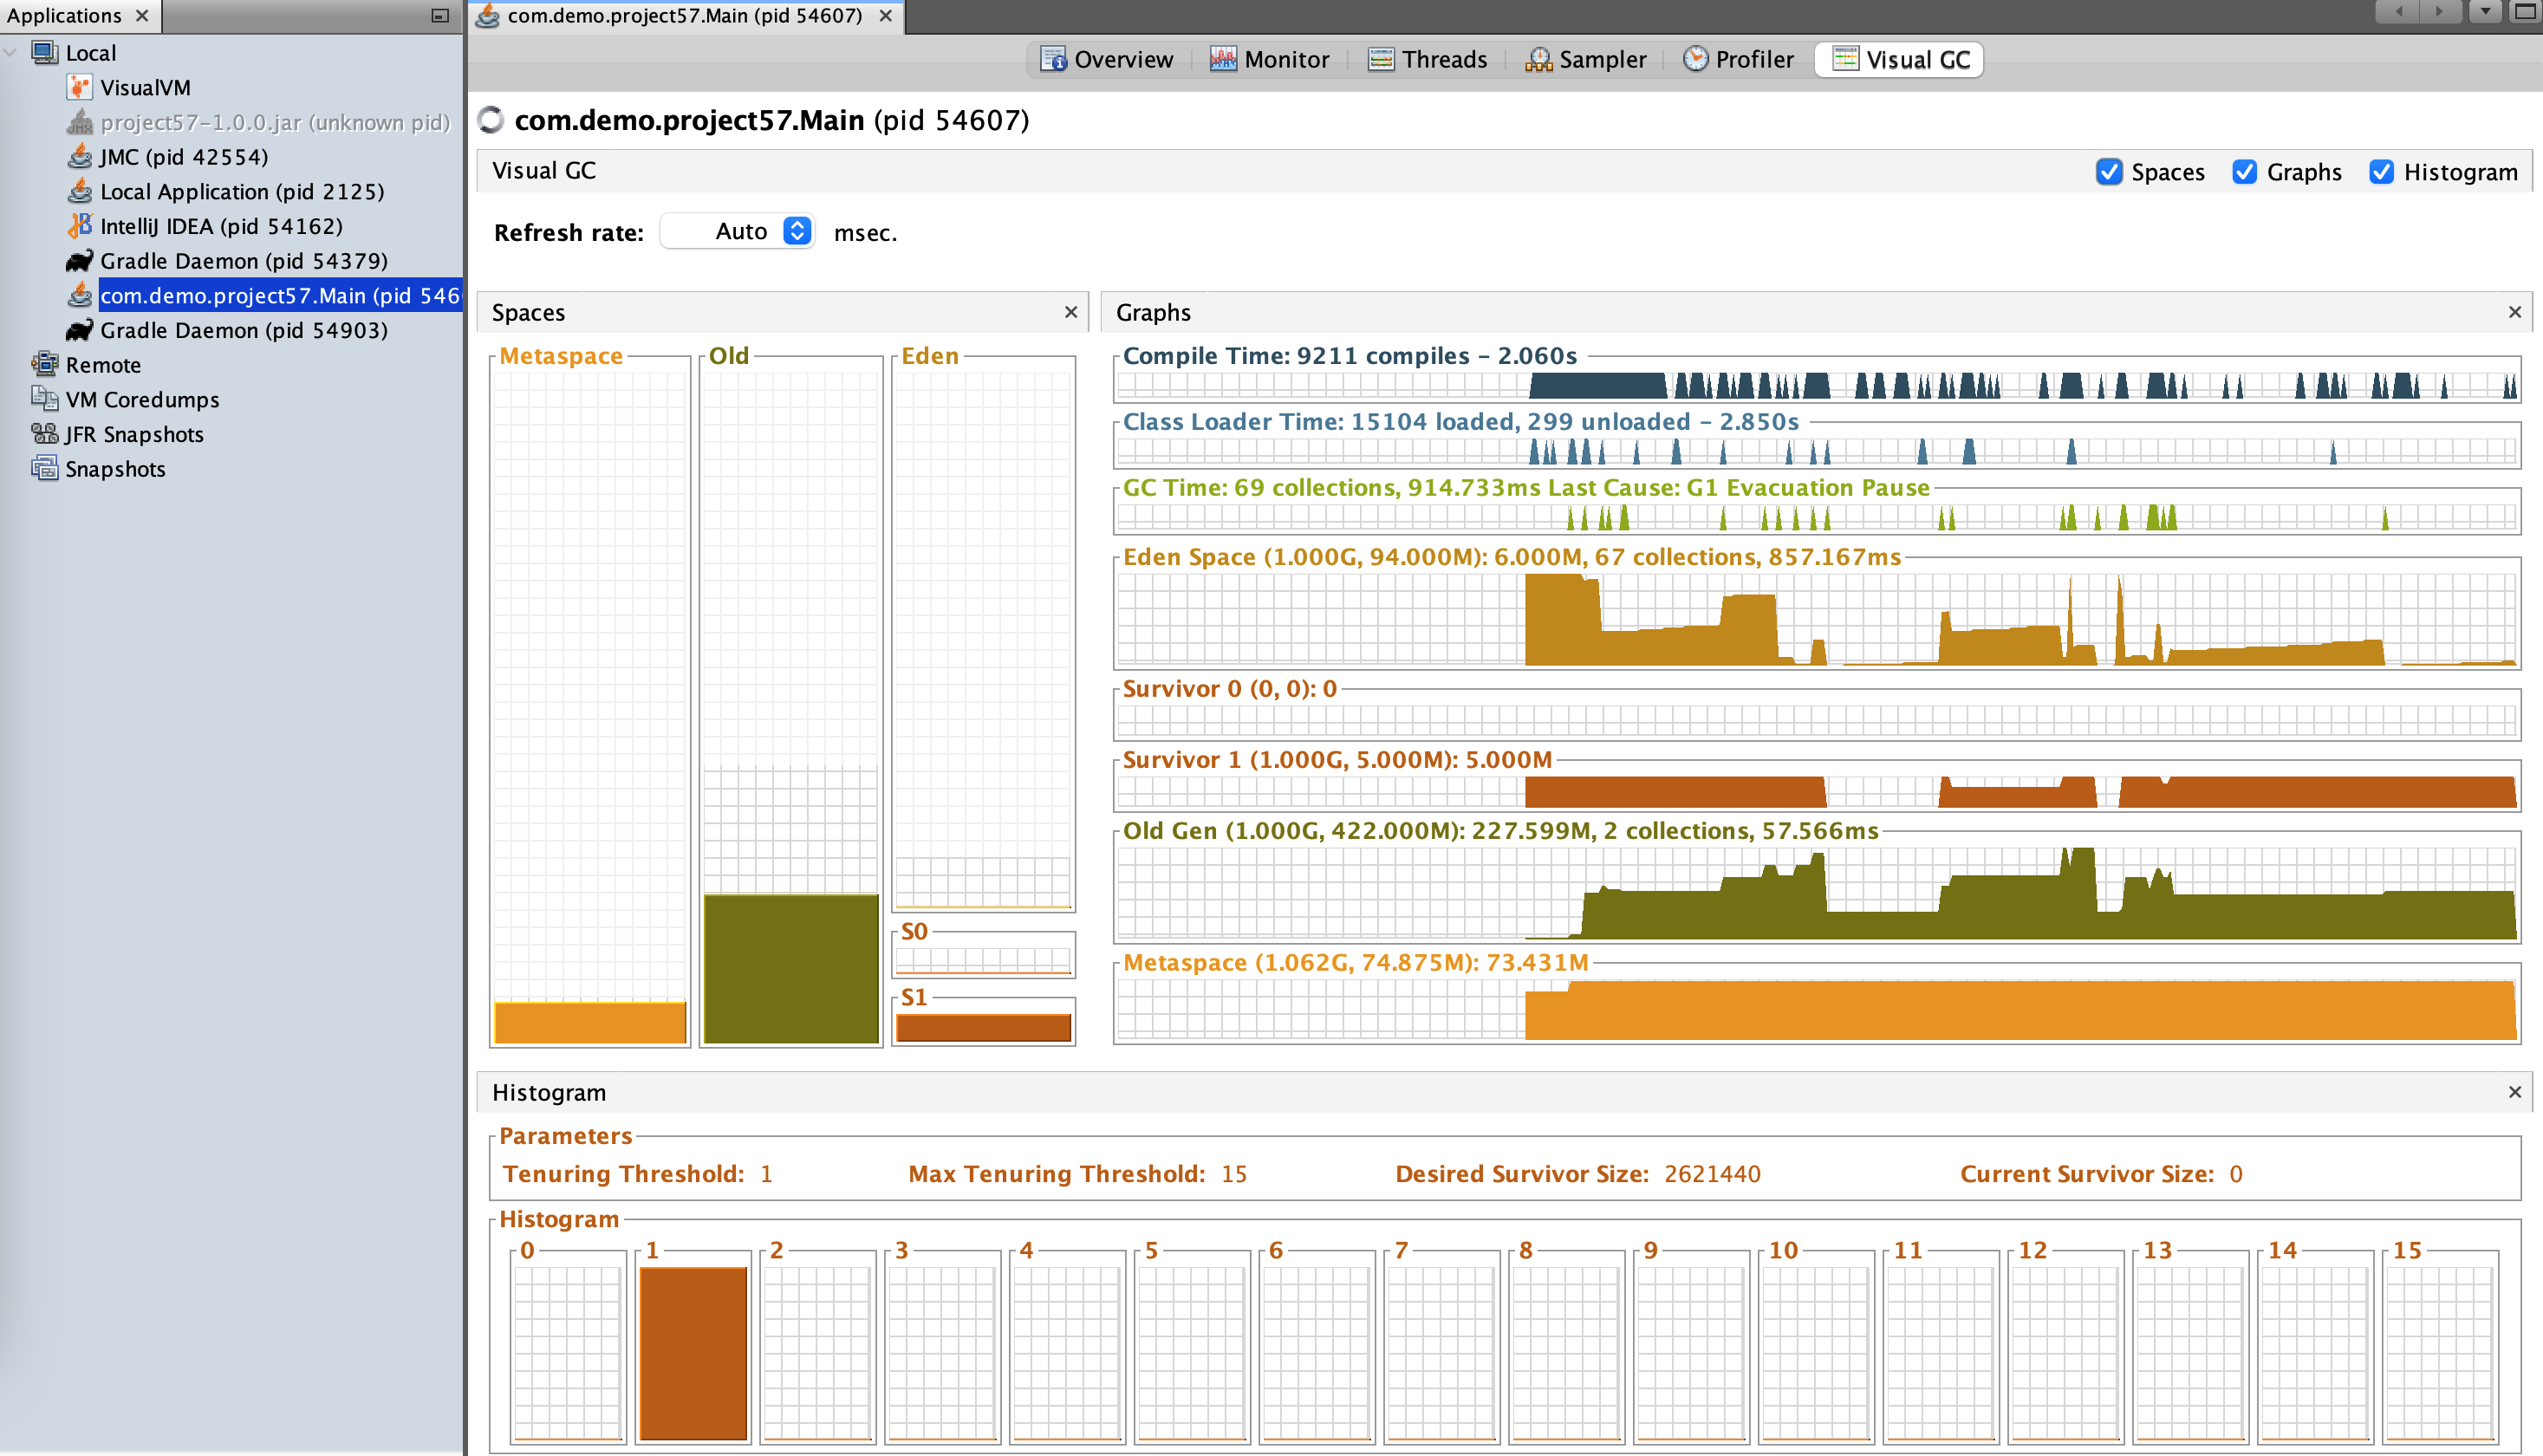
JVM tuning
Users are reporting that once in a while the API response is really long and it returns back to normal response time in a short while. What do you do?
Garbage collection can impact response times as GC is stop of the world event. When major GC happens it pauses all threads which might impact response time for time sensitive api.
Tune your JVM and enable logging and monitoring (actuator + prometheus) on the GC
-Xms, -Xmx- Places boundaries on the heap size to increase the predictability of garbage collection. The heap size is limited in replica servers so that even Full GCs do not trigger SIP retransmissions. -Xms sets the starting size to prevent pauses caused by heap expansion.-XX:+UseG1GC- Use the Garbage First (G1) Collector.-XX:MaxGCPauseMillis- Sets a target for the maximum GC pause time. This is a soft goal, and the JVM will make its best effort to achieve it.-XX:ParallelGCThreads- Sets the number of threads used during parallel phases of the garbage collectors. The default value varies with the platform on which the JVM is running.-XX:ConcGCThreads- Number of threads concurrent garbage collectors will use. The default value varies with the platform on which the JVM is running.-XX:InitiatingHeapOccupancyPercent- Percentage of the (entire) heap occupancy to start a concurrent GC cycle. GCs that trigger a concurrent GC cycle based on the occupancy of the entire heap and not just one of the generations, including G1, use this option. A value of 0 denotes 'do constant GC cycles'. The default value is 45.-XX:HeapDumpOnOutOfMemoryError- Will dump the heap to file in case of out of memory error.
 1'-server'
 2'-Xms250m',
 3'-Xmx500m',
 4'-XX:+HeapDumpOnOutOfMemoryError'
 5'-XX:+UseG1GC',
 6'-XX:MaxGCPauseMillis=200',
 7'-XX:ParallelGCThreads=20',
 8'-XX:ConcGCThreads=5',
 9'-XX:InitiatingHeapOccupancyPercent=70',
10'-Xlog:gc*=info:file=project57-gc.log:time,uptime,level,tags:filecount=5,filesize=100m
Server Startup Time
Your notice your server startup time is slow, it takes 10 sec for the server to startup. What do you do?
You can enable lazy initialization, Spring won’t create all beans on startup it will inject no dependencies until that bean is needed
You can check if autoconfigured beans are being set and disable them if not required.
1logging:
2  level:
3    org.springframework.boot.autoconfigure: DEBUG
Disable JMX beans to save on time
1spring:
2  jmx:
3    enabled: false
1spring:
2  main:
3    lazy-initialization: true
GraalVM uses Ahead of Time (AOT) Compilation creates a native binary image that doesn't require Java to run. It will increase startup time and reduce memory footprint. It optimizes by doing static analysis, removal of unused code, creating fixed classpath, etc.
Since Java 11, there is no pre-bundled JRE provided. As a result, basic Dockerfiles without any optimization can result in large image sizes. To reduce size of docker image
- Use Minimal Base Images
- Use Docker Multistage Builds
- Minimize the Number of Layers
- Use jlink to build custom JRE
- Create .dockerignore to leave out readme files.
- Use jdeps to strip dependencies not used.
Security
You have ensured that you don't print any customer information in logs, however the heapdump file that was shared in a ticket now exposes passwords to any user without access. What do you do?
Some of the basic security checks
- No credit card numbers in logs.
- No passwords in logs.
- No User personal information in logs.
- No PII (Personal Identifiable Information) in logs
- Permissions to production is restricted to few people by Authentication & Authorization.
- Salt has been added to password before storing it.
- Url don't have password or secure information in parameter as url get logged.
- Custom exceptions are thrown to customer and dont expose the backend exception to the end user.
- Cross site scripting is blocked.
- SQL injection attacks are blocked.
- Vulnerability scan are done and libraries updated to use latest fix.
- Input is always validated
- API keys / token is used to allow authenticated & authorized use of api
- Password are stored in encrypted format not in plain text, use Vault
- Allow listings (white listing) defines IP from which request can originate
- HTTPS upto gateway and HTTP can be used internally within network
- Audit logging trail is present to identify who changed what at what time. Use event sourcing where update events are queued and written to a secondary db/table.
- Data retention is planned to delete data which is no longer required.
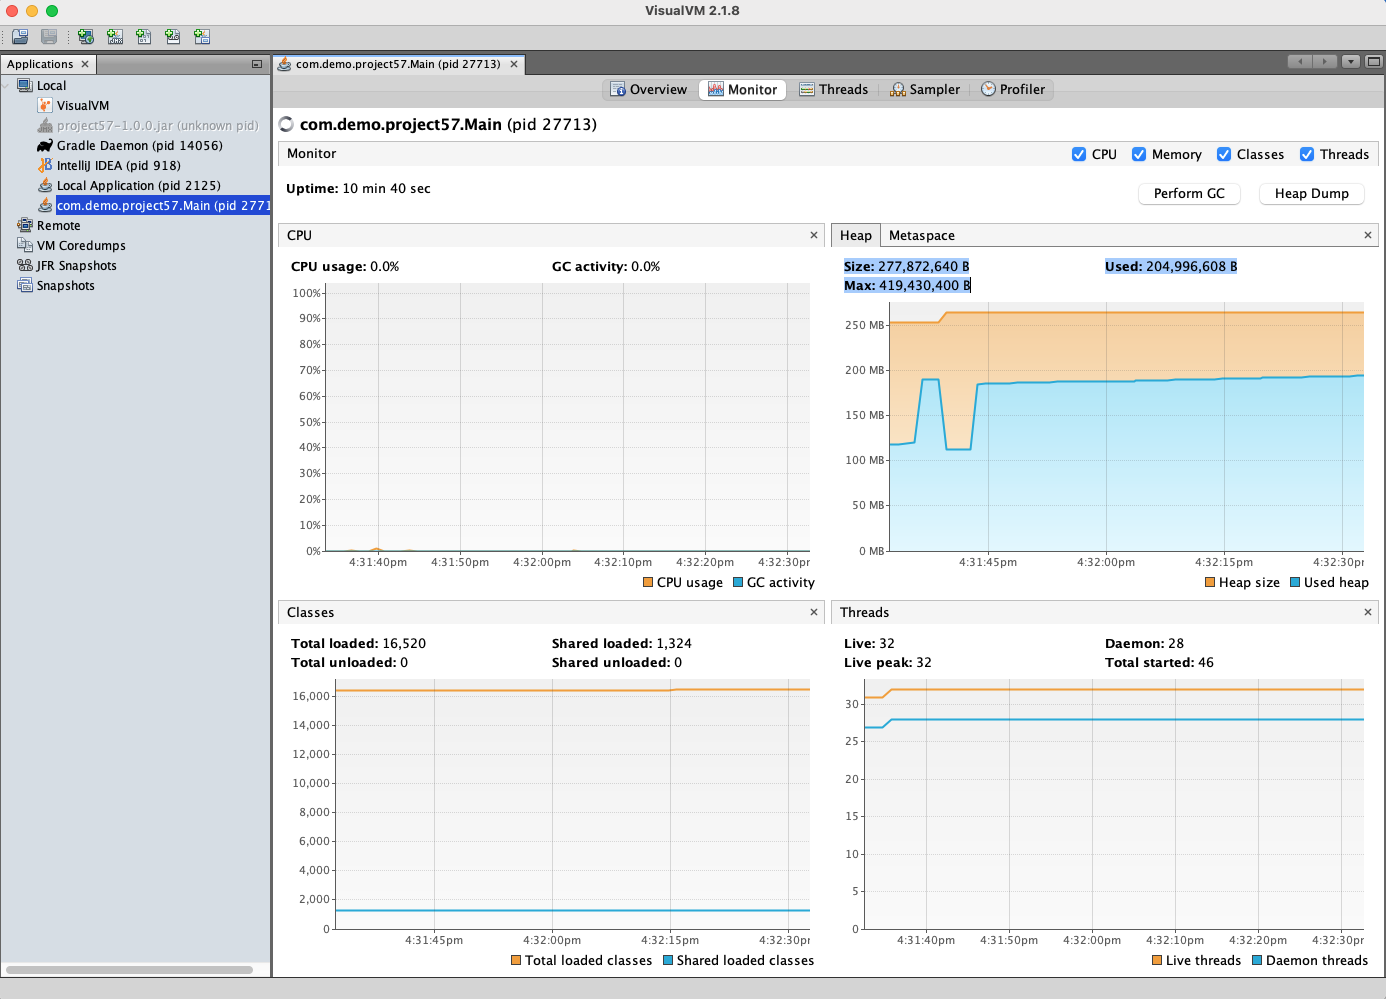
However heap dump file is one area that can leak passwords if the file is shared.
Trigger a password generation request and at the same time take a heap dump. You will see the password in plain text.
1curl --location 'http://localhost:8080/api/job15/60'
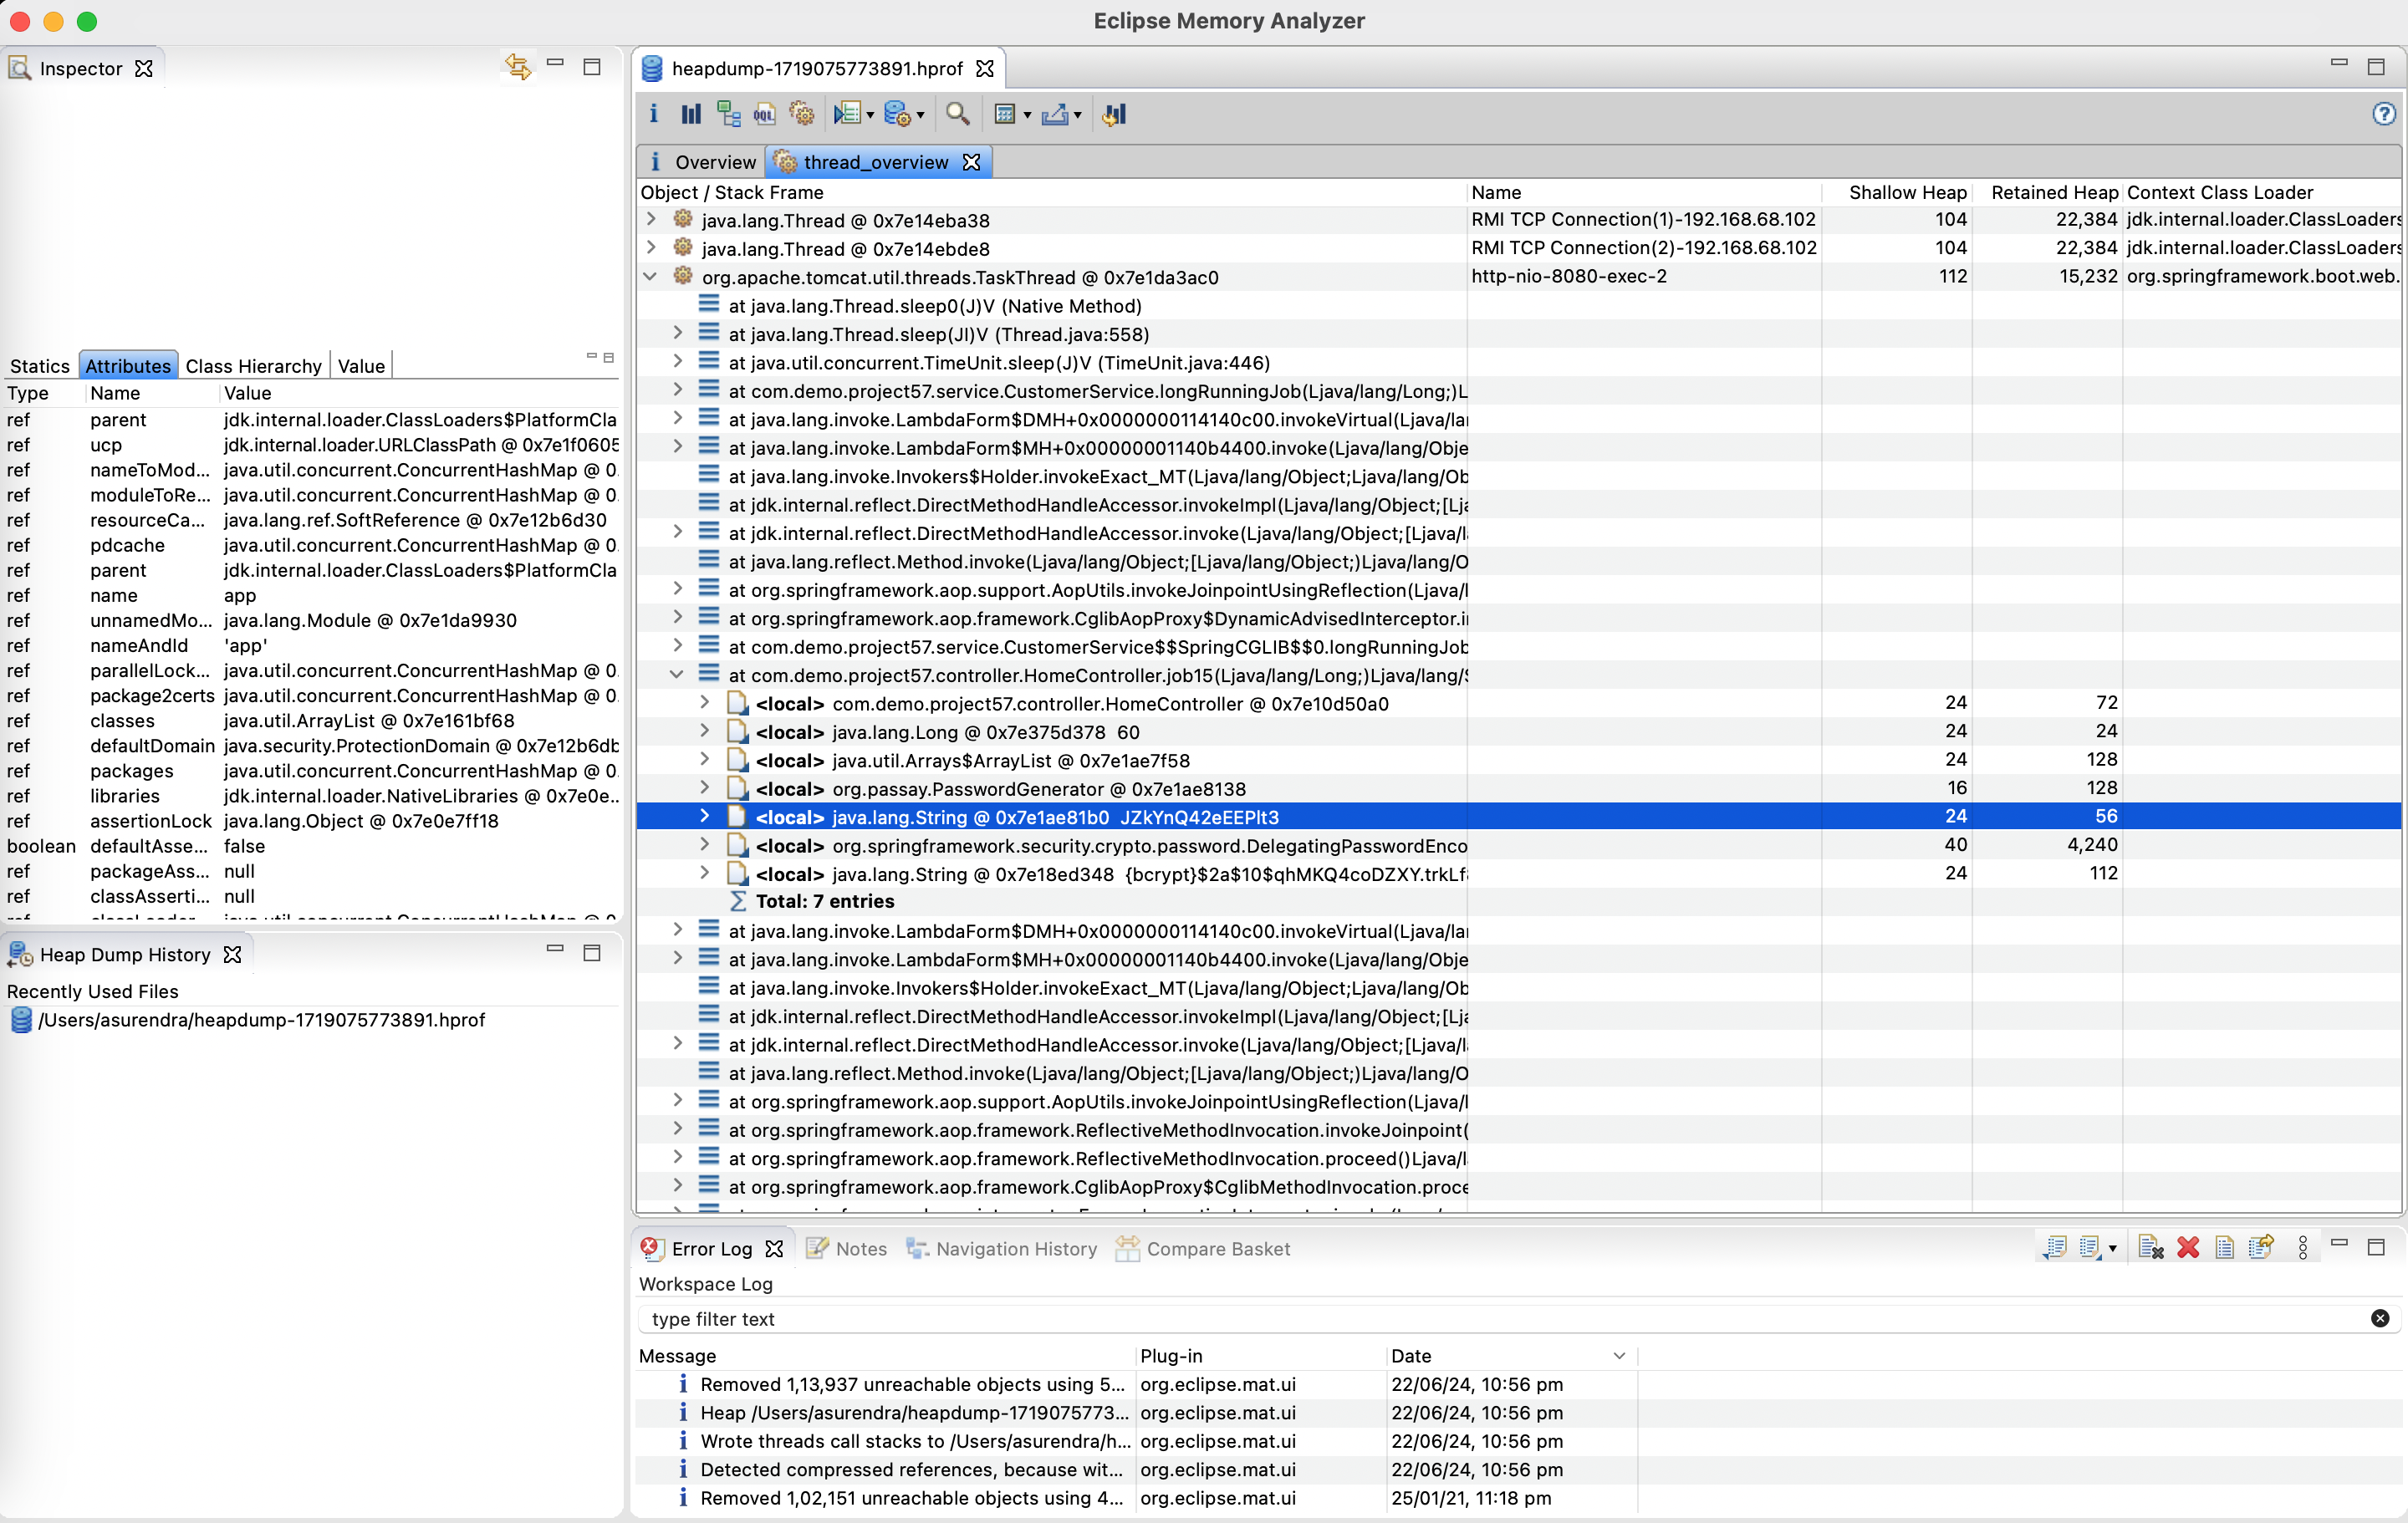
Heap dump files also need to protected with password similar to production data access.
Other Failures
Distributed system can fail at various points, other areas of failure that can happen and need to be factored in design are
- Primary DB failure or data corruption - Active-Active setup vs Active-Passive setup
- Secondary DB replication failure
- Queue failures - message loss during restart
- Network failures
- External Systems can go down
- Service nodes can go down so your service must be resilient to this
- Cache invalidation/eviction (TTL) failure
- Load Balancer failures
- Datacenter failure for one region
- Chaos Monkey testing
- CDN failure
- Audit Logging failure
- Network failure
Code
 1package com.demo.project57;
 2
 3import lombok.extern.slf4j.Slf4j;
 4import org.springframework.boot.CommandLineRunner;
 5import org.springframework.boot.SpringApplication;
 6import org.springframework.boot.autoconfigure.SpringBootApplication;
 7import org.springframework.context.annotation.Bean;
 8
 9@SpringBootApplication
10@Slf4j
11public class Main {
12    public static void main(String[] args) {
13        SpringApplication.run(Main.class, args);
14    }
15
16    @Bean
17    public CommandLineRunner onStart() {
18        return args -> {
19            log.info("On Start!");
20        };
21    }
22}
  1package com.demo.project57.controller;
  2
  3import java.net.InetAddress;
  4import java.time.Instant;
  5import java.time.LocalDateTime;
  6import java.util.ArrayList;
  7import java.util.Arrays;
  8import java.util.HashMap;
  9import java.util.List;
 10import java.util.Map;
 11import java.util.concurrent.CompletableFuture;
 12
 13import com.demo.project57.config.CloudConfig;
 14import com.demo.project57.domain.Customer;
 15import com.demo.project57.service.CustomerService;
 16import io.github.resilience4j.bulkhead.annotation.Bulkhead;
 17import io.github.resilience4j.circuitbreaker.annotation.CircuitBreaker;
 18import io.github.resilience4j.ratelimiter.annotation.RateLimiter;
 19import io.github.resilience4j.timelimiter.annotation.TimeLimiter;
 20import io.swagger.v3.oas.annotations.Operation;
 21import io.swagger.v3.oas.annotations.media.Content;
 22import io.swagger.v3.oas.annotations.media.Schema;
 23import io.swagger.v3.oas.annotations.responses.ApiResponse;
 24import io.swagger.v3.oas.annotations.responses.ApiResponses;
 25import jakarta.validation.Valid;
 26import lombok.AllArgsConstructor;
 27import lombok.Data;
 28import lombok.RequiredArgsConstructor;
 29import lombok.SneakyThrows;
 30import lombok.extern.slf4j.Slf4j;
 31import org.passay.CharacterRule;
 32import org.passay.EnglishCharacterData;
 33import org.passay.PasswordGenerator;
 34import org.springframework.cache.Cache;
 35import org.springframework.cache.CacheManager;
 36import org.springframework.data.domain.Pageable;
 37import org.springframework.http.ResponseEntity;
 38import org.springframework.security.crypto.factory.PasswordEncoderFactories;
 39import org.springframework.web.bind.annotation.GetMapping;
 40import org.springframework.web.bind.annotation.PathVariable;
 41import org.springframework.web.bind.annotation.PostMapping;
 42import org.springframework.web.bind.annotation.PutMapping;
 43import org.springframework.web.bind.annotation.RequestBody;
 44import org.springframework.web.bind.annotation.RequestMapping;
 45import org.springframework.web.bind.annotation.RestController;
 46import org.springframework.web.client.RestClient;
 47
 48@RestController
 49@RequiredArgsConstructor
 50@Slf4j
 51@RequestMapping("/api")
 52public class HomeController {
 53
 54    private final CustomerService customerService;
 55    private final RestClient restClient;
 56    private final CloudConfig cloudConfig;
 57    private final CacheManager cacheManager;
 58
 59    Map<MyKey, byte[]> customerMap = new HashMap<>();
 60    List<Customer> customerList;
 61    Cache cache;
 62
 63    @SneakyThrows
 64    @GetMapping("/time")
 65    public String getTime() {
 66        log.info("Getting server time!");
 67        String podName = InetAddress.getLocalHost().getHostName();
 68        return "Pod: " + podName + " : " + LocalDateTime.now();
 69    }
 70
 71    /**
 72     * Will block the tomcat threads and hence no other requests can be processed
 73     */
 74    @GetMapping("/blocking-job/{delay}")
 75    public String blockingJob(@PathVariable Long delay) {
 76        log.info("blockingJob request received, delay: {}", delay);
 77        return customerService.longRunningJob(delay);
 78    }
 79
 80    /**
 81     * Will not block the tomcat threads and hence no other requests can be processed
 82     */
 83    @GetMapping("/async-job/{delay}")
 84    public CompletableFuture<String> asyncJob(@PathVariable Long delay) {
 85        log.info("asyncJob request received, delay: {}", delay);
 86        return CompletableFuture.supplyAsync(() -> {
 87            return customerService.longRunningJob(delay);
 88        });
 89    }
 90
 91    /**
 92     * The @TimeLimiter will timeout if the job takes too long.
 93     * The job will still run in the background, There is no way to kill a thread in java you can only interrupt.
 94     */
 95    @GetMapping("/timeout-job/{delay}")
 96    @TimeLimiter(name = "project57-t1")
 97    public CompletableFuture<String> timeoutJob(@PathVariable Long delay) {
 98        log.info("timeoutJob request received, delay: {}", delay);
 99        return CompletableFuture.supplyAsync(() -> {
100            return customerService.longRunningJob(delay);
101        });
102    }
103
104    /**
105     * API calling an external API that is not responding
106     * Here timeout on the rest client is configured
107     */
108    @GetMapping("/external-api-job/{delay}")
109    public String externalApiJob(@PathVariable Long delay) {
110        log.info("externalApiJob request received, delay: {}", delay);
111        String result = restClient.get()
112                .uri("/users/1?_delay=" + (delay * 1000))
113                .retrieve()
114                .body(String.class);
115        log.info("externalApiJob response: {}", result);
116        return result;
117    }
118
119    /**
120     * Over user of db connection by run-away thread pool
121     */
122    @GetMapping("/async-db-job/{threads}")
123    public void asyncDbJob(@PathVariable int threads) {
124        log.info("asyncDbJob request received, threads: {}", threads);
125        customerService.invokeAsyncDbCall(threads, 1);
126    }
127
128    /**
129     * Long-running query without timeout
130     * Explicit delay of 10 seconds introduced in DB query
131     */
132    @GetMapping("/db-long-query-job/{delay}")
133    public int dbLongQueryJob(@PathVariable Long delay) {
134        log.info("dbLongQueryJob request received, delay: {}", delay);
135        return customerService.getCustomerCount1(delay);
136    }
137
138    /**
139     * Long-running query with timeout of 5 seconds
140     */
141    @GetMapping("/db-long-query-timeout-job/{delay}")
142    public int dbLongQueryTimeoutJob(@PathVariable Long delay) {
143        log.info("dbLongQueryTimeoutJob request received, delay: {}", delay);
144        return customerService.getCustomerCount2(delay);
145    }
146
147    /**
148     * Create memory leak and spike in heap memory
149     * Map keeps growing on each call and eventually causes OOM error
150     * If the key is unique the map should have fixed set of entries no matter how many times we invoke
151     * Key in hashmap has to be immutable
152     */
153    @GetMapping("/memory-leak-job/{records}")
154    public ResponseEntity memoryLeakJob(@PathVariable Long records) {
155        log.info("memoryLeakJob request received");
156        for (int i = 0; i < records; i++) {
157            //By creating a non-immutable key it creates a memory leak
158            customerMap.put(new MyKey("customer_" + i), new byte[100000]);
159        }
160        return ResponseEntity.ok().build();
161    }
162
163    /**
164     * Will allow GC to recover the space
165     */
166    @GetMapping("/load-heap-job/{records}")
167    public ResponseEntity loadHeapJob(@PathVariable Long records) {
168        log.info("loadHeapJob request received");
169        customerList = new ArrayList<>();
170        for (int i = 0; i < records; i++) {
171            //By creating a non-immutable key it creates a memory leak
172            customerList.add(Customer.builder()
173                    .id(Long.valueOf(i))
174                    .name("customer_" + i)
175                    .city("city_" + i)
176                    .build());
177        }
178        return ResponseEntity.ok().build();
179    }
180
181    /**
182     * Bulk head
183     */
184    @GetMapping("/bulk-head-job")
185    @Bulkhead(name = "project57-b1")
186    public String bulkHeadJob() {
187        log.info("bulkHeadJob request received");
188        return customerService.longRunningJob(5l);
189    }
190
191    /**
192     * Rate limit
193     */
194    @GetMapping("/rate-limit-job")
195    @RateLimiter(name = "project57-r1")
196    public String rateLimitJob(@PathVariable Long delay) {
197        log.info("rateLimitJob request received");
198        return customerService.longRunningJob(5l);
199    }
200
201    @GetMapping("/retry-job")
202    public String retryJob() {
203        log.info("retryJob request received");
204        return customerService.getTime();
205    }
206
207    /**
208     * If this api keeps failing, after 50% failure rate the circuit will be closed
209     * It will then return 503 Service Unavailable
210     */
211    @GetMapping("/circuit-breaker-job/{fail}")
212    @CircuitBreaker(name = "project57-c1")
213    public String circuitBreakerJob(@PathVariable Boolean fail) {
214        log.info("circuitBreakerJob request received");
215        if (fail) {
216            throw new RuntimeException("Failed Job!");
217        } else {
218            return Instant.now().toString();
219        }
220    }
221
222    /**
223     * Secret Password generated using library Passay
224     * Use salt and encode password before storing them.
225     */
226    @GetMapping("/password-gen-job/{delay}")
227    public String passwordGenJob(@PathVariable Long delay) {
228        log.info("passwordGenJob request received");
229        List<CharacterRule> charList = Arrays.asList(
230                new CharacterRule(EnglishCharacterData.UpperCase, 2),
231                new CharacterRule(EnglishCharacterData.LowerCase, 2),
232                new CharacterRule(EnglishCharacterData.Digit, 2));
233        PasswordGenerator passwordGenerator = new PasswordGenerator();
234        String newPassword = passwordGenerator.generatePassword(15, charList);
235        log.info("Password generated, Wont be printed!");
236        var encoder = PasswordEncoderFactories.createDelegatingPasswordEncoder();
237        String encodedPassword = encoder.encode(newPassword);
238        log.info("Encoded Password {}", encodedPassword);
239        customerService.longRunningJob(delay);
240        return encodedPassword;
241    }
242
243    /**
244     * Depending on the feature flag a different code will be executed.
245     * Feature flag can be updated/refreshed while server is running
246     */
247    @GetMapping("/feature-job")
248    public String featureJob() {
249        log.info("featureJob request received");
250        if (cloudConfig.getNewFeatureFlag()) {
251            return "Feature v2";
252        } else {
253            return "Feature v1";
254        }
255    }
256
257    @GetMapping("/customer")
258    public Iterable<Customer> findAllCustomer() {
259        log.info("Finding All Customers!");
260        return customerService.findAllCustomer();
261    }
262
263    @PostMapping("/customer")
264    public Customer saveCustomer(@RequestBody @Valid Customer customer) {
265        log.info("Saving Customer!");
266        return customerService.saveCustomer(customer);
267    }
268
269    @GetMapping("/customer-page")
270    public Iterable<Customer> findAllCustomerByPage(Pageable pageable) {
271        log.info("Finding All Customers By Page!");
272        return customerService.findAllCustomerByPage(pageable);
273    }
274
275    @PutMapping("/cache-put/{key}/{value}")
276    public String cachePut(@PathVariable String key, @PathVariable String value) {
277        log.info("cachePut request received");
278        cache = cacheManager.getCache("countryCache");
279        cache.put(key, value);
280        return "done!";
281    }
282
283    @GetMapping("/cache-get/{key}")
284    public String cacheGet(@PathVariable String key) {
285        log.info("cacheGet request received");
286        cache = cacheManager.getCache("countryCache");
287        return String.valueOf(cache.get(key).get());
288    }
289
290    @GetMapping("/error")
291    public ResponseEntity<?> errorJob() {
292        log.info("error request received");
293        throw new RuntimeException("My Custom Error");
294    }
295
296    @Operation(summary = "Greet Controller")
297    @ApiResponses(value = {
298            @ApiResponse(responseCode = "200", description = "Found User", content = {@Content(mediaType = "application/json", schema = @Schema(implementation = Greet.class))}),
299            @ApiResponse(responseCode = "400", description = "Invalid User Provided", content = @Content),
300            @ApiResponse(responseCode = "404", description = "User Not Found", content = @Content)})
301    @GetMapping("/greet/{name}")
302    public ResponseEntity<Greet> greet(@PathVariable String name) {
303        if (name == null || name.isBlank()) {
304            return ResponseEntity.badRequest().build();
305        }
306        if (name.equalsIgnoreCase("unknown")) {
307            return ResponseEntity.notFound().build();
308        }
309        return ResponseEntity.ok(new Greet("Hello " + name));
310    }
311
312    @GetMapping("/fetch/{city}")
313    public List<Customer> getByCity(@PathVariable String city) {
314        log.info("Fetching by city request received");
315        return customerService.getByCity(city);
316    }
317
318    @AllArgsConstructor
319    @Data
320    class MyKey {
321        String key;
322    }
323
324    @AllArgsConstructor
325    @Data
326    class Greet {
327        String message;
328    }
329
330}
 1package com.demo.project57.service;
 2
 3import java.time.LocalDateTime;
 4import java.util.List;
 5import java.util.concurrent.TimeUnit;
 6import java.util.concurrent.atomic.AtomicLong;
 7
 8import com.demo.project57.domain.Customer;
 9import com.demo.project57.exception.CustomerException;
10import com.demo.project57.repository.CustomerRepository;
11import io.github.resilience4j.retry.annotation.Retry;
12import lombok.RequiredArgsConstructor;
13import lombok.SneakyThrows;
14import lombok.extern.slf4j.Slf4j;
15import org.springframework.data.domain.Pageable;
16import org.springframework.http.HttpStatusCode;
17import org.springframework.stereotype.Service;
18import org.springframework.transaction.annotation.Transactional;
19import org.springframework.web.client.HttpClientErrorException;
20
21@Service
22@RequiredArgsConstructor
23@Slf4j
24public class CustomerService {
25
26    private final CustomerRepository customerRepository;
27    private final CustomerAsyncService customerAsyncService;
28    AtomicLong counter = new AtomicLong();
29
30    public Iterable<Customer> findAllCustomer() {
31        return customerRepository.findAll();
32    }
33
34    public Iterable<Customer> findAllCustomerByPage(Pageable pageable) {
35        return customerRepository.findAll(pageable);
36    }
37
38    /**
39     * Will block till the db returns data
40     */
41    public int getCustomerCount1(long delay) {
42        return customerRepository.getCustomerCount(delay);
43    }
44
45    /**
46     * Will time out after 5 seconds
47     */
48    @Transactional(timeout = 5)
49    public int getCustomerCount2(long delay) {
50        return customerRepository.getCustomerCount(delay);
51    }
52
53    /**
54     * Will invoke db call from multiple threads
55     */
56    public void invokeAsyncDbCall(int threads, long delay) {
57        for (int i = 0; i < threads; i++) {
58            //Query the DB 'N' times
59            customerAsyncService.getCustomerCount(delay);
60        }
61    }
62
63    @SneakyThrows
64    public String longRunningJob(Long delay) {
65        log.info("Long running job started!");
66        TimeUnit.SECONDS.sleep(delay);
67        log.info("Long running job completed!");
68        return "Job completed @" + LocalDateTime.now();
69    }
70
71    @Retry(name = "project57-y1")
72    public String getTime() {
73        log.info("Getting time from api!");
74        //Simulating a failure first 2 times
75        if (counter.incrementAndGet() < 3) {
76            throw new HttpClientErrorException(HttpStatusCode.valueOf(500));
77        } else {
78            counter = new AtomicLong();
79            return String.valueOf(LocalDateTime.now());
80        }
81    }
82
83    public Customer saveCustomer(Customer customer) {
84        if (customer.getCity().equals("unknown")) {
85            throw new CustomerException("Unknown city for customer!");
86        }
87        return customerRepository.save(customer);
88    }
89
90    public List<Customer> getByCity(String city) {
91        return customerRepository.getByCity(city);
92    }
93}
 1package com.demo.project57.service;
 2
 3import com.demo.project57.repository.CustomerRepository;
 4import lombok.RequiredArgsConstructor;
 5import lombok.extern.slf4j.Slf4j;
 6import org.springframework.scheduling.annotation.Async;
 7import org.springframework.scheduling.annotation.EnableAsync;
 8import org.springframework.stereotype.Service;
 9import org.springframework.transaction.annotation.Propagation;
10import org.springframework.transaction.annotation.Transactional;
11
12@Service
13@EnableAsync
14@RequiredArgsConstructor
15@Slf4j
16public class CustomerAsyncService {
17    private final CustomerRepository customerRepository;
18
19    /**
20     * Each method run in parallel causing connection pool to become full.
21     * Explicitly creating many connections so we run out of connections
22     */
23    @Transactional(propagation = Propagation.REQUIRES_NEW)
24    @Async
25    public void getCustomerCount(long delay) {
26        log.info("getCustomerCount invoked!");
27        int count = customerRepository.getCustomerCount(delay);
28        log.info("getCustomerCount completed: {}", count);
29    }
30
31}
  1spring:
  2  main:
  3    banner-mode: "off"
  4    lazy-initialization: false
  5  datasource:
  6    driver-class-name: org.postgresql.Driver
  7    url: jdbc:postgresql://${POSTGRES_HOST}:5432/${POSTGRES_DB}
  8    username: ${POSTGRES_USER}
  9    password: ${POSTGRES_PASSWORD}
 10    hikari:
 11      maximumPoolSize: 5
 12      connectionTimeout: 1000
 13      idleTimeout: 60
 14      maxLifetime: 180
 15  jpa:
 16    show-sql: false
 17    hibernate.ddl-auto: none
 18    database-platform: org.hibernate.dialect.PostgreSQLDialect
 19    defer-datasource-initialization: false
 20    properties:
 21      hibernate:
 22        show_sql: false
 23        format_sql: true
 24    open-in-view: false
 25  threads:
 26    virtual:
 27      enabled: false
 28  cloud:
 29    config:
 30      enabled: false
 31  task:
 32    execution:
 33      simple:
 34        concurrency-limit: 10
 35    scheduling:
 36      simple:
 37        concurrency-limit: 10
 38  mvc:
 39    async:
 40      request-timeout: 5000
 41  liquibase:
 42    change-log: db/changelog/db.changelog.yaml
 43    enabled: true
 44server:
 45  http2:
 46    enabled: false
 47  port: 8080
 48  compression:
 49    enabled: true
 50    # Minimum response when compression will kick in
 51    min-response-size: 512
 52    # Mime types that should be compressed
 53    mime-types: text/xml, text/plain, application/json
 54  tomcat:
 55    connection-timeout: 500
 56    threads:
 57      max: 10 # Maximum amount of worker threads.
 58      min-spare: 10 # Minimum amount of worker threads.
 59    max-connections: 10 # Maximum number of connections that the server accepts and processes.
 60    max-keep-alive-requests: 10
 61    keep-alive-timeout: 10
 62    accept-count: 100 # Maximum queue size for incoming connection requests
 63  error:
 64    include-binding-errors: always
 65    include-exception: false
 66    include-message: always
 67    include-path: always
 68    include-stacktrace: never
 69
 70resilience4j:
 71  timelimiter:
 72    instances:
 73      project57-t1:
 74        timeoutDuration: 5s
 75        cancelRunningFuture: true
 76    metrics:
 77      enabled: true
 78  ratelimiter:
 79    instances:
 80      project57-r1:
 81        limit-for-period: 5
 82        limit-refresh-period: 1s
 83        timeout-duration: 0s
 84    metrics:
 85      enabled: true
 86  bulkhead:
 87    instances:
 88      project57-b1:
 89        max-concurrent-calls: 2
 90        max-wait-duration: 10ms
 91    metrics:
 92      enabled: true
 93  retry:
 94    instances:
 95      project57-y1:
 96        max-attempts: 3
 97        waitDuration: 10s
 98        enableExponentialBackoff: true
 99        exponentialBackoffMultiplier: 2
100        retryExceptions:
101          - org.springframework.web.client.HttpClientErrorException
102        ignoreExceptions:
103          - org.springframework.web.client.HttpServerErrorException
104    metrics:
105      enabled: true
106  circuitbreaker:
107    instances:
108      project57-c1:
109        failure-rate-threshold: 50
110        minimum-number-of-calls: 5
111        automatic-transition-from-open-to-half-open-enabled: true
112        wait-duration-in-open-state: 5s
113        permitted-number-of-calls-in-half-open-state: 3
114        sliding-window-size: 10
115        sliding-window-type: count_based
116    metrics:
117      enabled: true
118
119logging:
120  pattern:
121    level: '%5p [${HOSTNAME:}]'
122  level:
123    root: info
124    org.hibernate.SQL: DEBUG
125    org.hibernate.type.descriptor.sql.BasicBinder: TRACE
126    org.hibernate.orm.jdbc.bind: TRACE
127  file:
128    name: logs/project57-app-${HOSTNAME}.log
129  logback:
130    rollingpolicy:
131      file-name-pattern: logs/%d{yyyy-MM, aux}/project57-app-${HOSTNAME}.%d{yyyy-MM-dd}.%i.log
132      max-file-size: 100MB
133      total-size-cap: 10GB
134      max-history: 10
135
136management:
137  endpoint:
138    refresh:
139      enabled: true
140    health:
141      enabled: true
142      show-details: always
143      show-components: always
144    metrics:
145      enabled: true
146    info:
147      env:
148        enabled: true
149      enabled: true
150    env:
151      post:
152        enabled: true
153  endpoints:
154    web:
155      exposure:
156        include: '*'
157
158project57:
159  newFeatureFlag: false
Postman
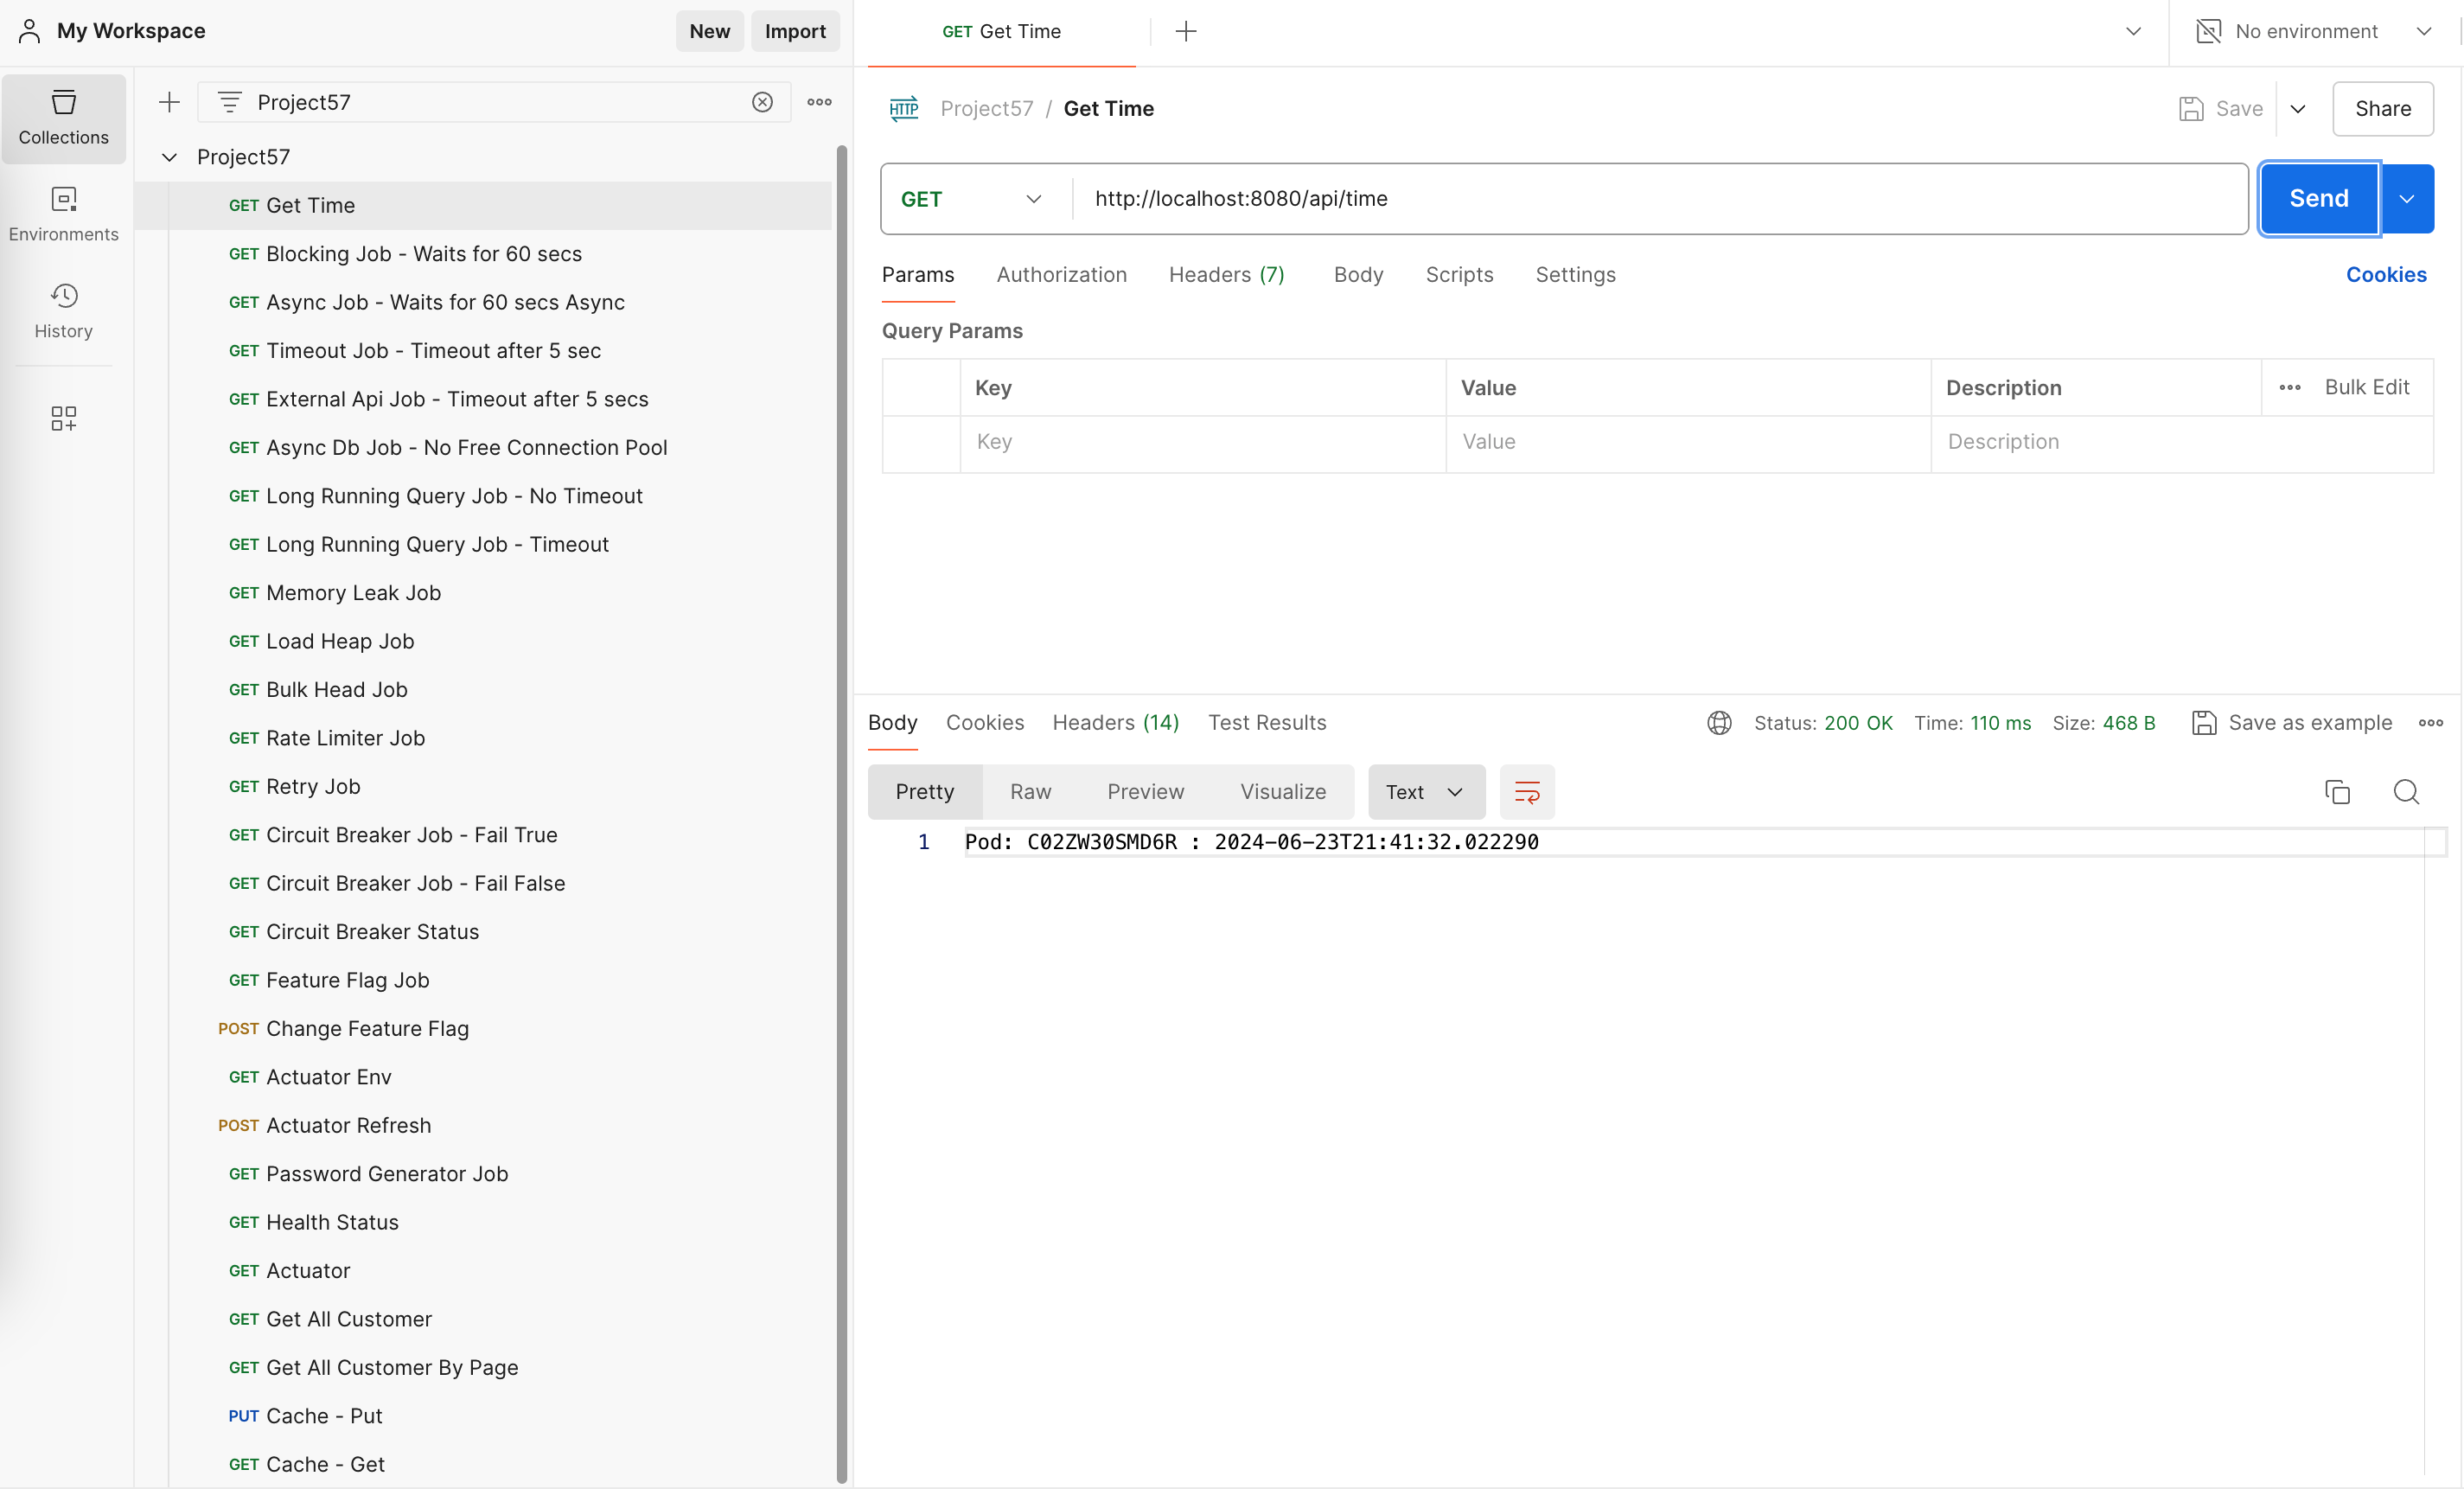
Import the postman collection to postman
Setup
 1# Project 57
 2
 3Distributed System Essentials
 4
 5[https://gitorko.github.io/distributed-system-essentials/](https://gitorko.github.io/distributed-system-essentials/)
 6
 7### Version
 8
 9Check version
10
11```bash
12$java --version
13openjdk 21.0.3 2024-04-16 LTS
14```
15
16### Postgres DB
17
18```bash
19docker run -p 5432:5432 --name pg-container -e POSTGRES_PASSWORD=password -d postgres:14
20docker ps
21docker exec -it pg-container psql -U postgres -W postgres
22CREATE USER test WITH PASSWORD 'test@123';
23CREATE DATABASE "test-db" WITH OWNER "test" ENCODING UTF8 TEMPLATE template0;
24grant all PRIVILEGES ON DATABASE "test-db" to test;
25
26docker stop pg-container
27docker start pg-container
28```
29
30To run postgres with `pg_hint_plan`
31
32```bash
33docker build --no-cache -t my-postgres-image -f docker/Dockerfile .
34docker run -p 5432:5432 --name my-postgres-container -e POSTGRES_PASSWORD=mysecretpassword -d my-postgres-image
35docker exec -it my-postgres-container psql -U postgres -W postgres
36CREATE USER test WITH PASSWORD 'test@123';
37CREATE DATABASE "test-db" WITH OWNER "test" ENCODING UTF8 TEMPLATE template0;
38grant all PRIVILEGES ON DATABASE "test-db" to test;
39
40CREATE EXTENSION pg_hint_plan;
41```
42
43### Dev
44
45To run the backend in dev mode.
46
47```bash
48./gradlew clean build
49./gradlew bootRun
50
51```
52
53Command to check port on Mac
54
55```bash
56lsof -i tcp:8080
57```
58
59### Kubernetes
60
61Stop any existing postgres db
62
63```bash
64docker stop pg-container
65brew services stop postgresql@14
66```
67
68```bash
69kubectl config use-context docker-desktop
70
71mkdir /tmp/data
72
73./gradlew clean build
74docker build -f k8s/Dockerfile --force-rm -t project57:1.0.0 .
75kubectl apply -f k8s/deployment.yaml
76kubectl get pods -w
77
78kubectl logs -f service/project57-service
79
80kubectl delete -f k8s/deployment.yaml
81```
82
83To build a small docker image
84
85```bash
86docker build -f k8s/Dockerfile-Small --force-rm -t project57:1.0.0 .
87docker run -d -p 8080:8080 -e POSTGRES_HOST="10.177.140.150" -e POSTGRES_DB="test-db" -e POSTGRES_USER="test" -e POSTGRES_PASSWORD="test@123" project57:1.0.0
88```
89
90### Swagger
91
92[http://localhost:8080/swagger-ui/index.html](http://localhost:8080/swagger-ui/index.html)
93
94[http://localhost:8080/v3/api-docs](http://localhost:8080/v3/api-docs)