Spring - Micrometer
Overview
Spring Boot with Micrometer & Integration with Prometheus & Grafana.
Github: https://github.com/gitorko/project68
Micrometer
Micrometer provides vendor neutral application metrics facade that can integrate with various monitoring systems like Prometheus, Wavefront, Atlas, Datadog, Graphite, Ganglia, Influx, JMX etc.
Traditional systems which monitored JMX attributes could only do so at a particular instance of time. With the arrival of time series database we can now use that data and visualize it over a period in time. Writing the integration to various monitoring systems is time consuming, hence micrometer simplifies it. Underlying metrics are exposed by Spring Boot Actuator and then Micrometer provides a facade that can be used to either push or pull metrics to monitoring systems.
Every meter has a name (hierarchical) and tag. There are 4 main types of meters.
- Timers - Time taken to run something.
- Counter - Number of time something was run.
- Guages - Report data when observed. Gauges can be useful when monitoring stats of cache, collections
- Distribution summary - Distribution of events.
MeterRegistryCustomizer, you can customize the whole set of registries at once or individual implementation.
Code
 1package com.demo.project68;
 2
 3import io.micrometer.core.annotation.Timed;
 4import io.micrometer.core.instrument.Counter;
 5import io.micrometer.core.instrument.MeterRegistry;
 6import io.micrometer.core.instrument.Metrics;
 7import jakarta.annotation.PostConstruct;
 8import lombok.extern.slf4j.Slf4j;
 9import org.springframework.beans.factory.annotation.Value;
10import org.springframework.boot.SpringApplication;
11import org.springframework.boot.actuate.autoconfigure.metrics.MeterRegistryCustomizer;
12import org.springframework.boot.autoconfigure.SpringBootApplication;
13import org.springframework.context.annotation.Bean;
14import org.springframework.context.annotation.Configuration;
15import org.springframework.context.annotation.EnableAspectJAutoProxy;
16import org.springframework.web.bind.annotation.GetMapping;
17import org.springframework.web.bind.annotation.RequestMapping;
18import org.springframework.web.bind.annotation.RestController;
19
20import java.util.Random;
21import java.util.concurrent.TimeUnit;
22
23@SpringBootApplication
24@Slf4j
25public class Main {
26    public static void main(String[] args) {
27        SpringApplication.run(Main.class, args);
28    }
29}
30
31@RestController
32@RequestMapping("/api")
33@Slf4j
34class AppController {
35
36    @Timed("hello.api.time")
37    @GetMapping("/hello")
38    public String sayHello() throws InterruptedException {
39        RegistryConfig.helloApiCounter.increment();
40        int sleepTime = new Random().nextInt(10);
41        log.info("Sleeping for seconds: {}", sleepTime);
42        TimeUnit.SECONDS.sleep(sleepTime);
43        return "Hello, Sleep for " + sleepTime + " Seconds!";
44    }
45}
46
47@Configuration
48@EnableAspectJAutoProxy
49class RegistryConfig {
50
51    public static Counter helloApiCounter;
52
53    @Bean
54    MeterRegistryCustomizer<MeterRegistry> configurer(@Value("${spring.application.name}") String applicationName) {
55        return registry -> registry.config().commonTags("application", applicationName);
56    }
57
58    @PostConstruct
59    public void postInit() {
60        helloApiCounter = Metrics.counter("hello.api.count", "type", "order");
61    }
62}
 1server:
 2  port: 8080
 3management:
 4  metrics:
 5    export:
 6      prometheus:
 7        enabled: true
 8  endpoints:
 9    web:
10      exposure:
11        include: "*"
12  endpoint:
13    metrics:
14      enabled: true
15    prometheus:
16      enabled: true
17    metrics.enabled: true
18spring:
19  application:
20    name: myapp
 1global:
 2  scrape_interval: 10s
 3  scrape_timeout: 5s
 4  evaluation_interval: 10s
 5alerting:
 6  alertmanagers:
 7    - static_configs:
 8        - targets: []
 9      scheme: http
10      timeout: 10s
11scrape_configs:
12  - job_name: myapp
13    scrape_interval: 10s
14    scrape_timeout: 5s
15    metrics_path: /actuator/prometheus
16    scheme: http
17    static_configs:
18      - targets:
19          - 192.168.68.104:8080
Setup
 1# Project 68
 2
 3Spring Boot Micrometer - Prometheus, Wavefront
 4
 5[https://gitorko.github.io/spring-boot-micrometer/](https://gitorko.github.io/spring-boot-micrometer/)
 6
 7### Version
 8
 9Check version
10
11```bash
12$java --version
13openjdk 17.0.3 2022-04-19 LTS
14```
15
16### Dev
17
18To run code.
19
20```bash
21./gradlew clean build
22./gradlew bootRun
23```
24
25## Prometheus
26
27Update the target ip-address in the prometheus.yml file, don't use localhost when using docker container
28
29To start the prometheus docker instance build the docker image & run the image.
30
31```bash
32cd project68
33docker build -f docker/Dockerfile --force-rm -t my-prometheus .
34docker run -p 9090:9090 my-prometheus
35```
36
37## Grafana
38
39To start the grafana docker instance run the command.
40
41```bash
42docker run --name grafana -d -p 3000:3000 grafana/grafana
43```
Prometheus & Grafana
Invoke the rest api couple of times.
1curl http://localhost:8080/api/hello
Check if the metrics are returned by actuator
http://localhost:8080/actuator/prometheus
You should see metrics similar to
1hello_api_count_total{application="myapp",type="order",} 27.0
2hello_api_time_seconds_count{application="myapp",exception="None",method="GET",outcome="SUCCESS",status="200",uri="/api/hello",} 27.0
3hello_api_time_seconds_sum{application="myapp",exception="None",method="GET",outcome="SUCCESS",status="200",uri="/api/hello",} 102.162818601
4hello_api_time_seconds_max{application="myapp",exception="None",method="GET",outcome="SUCCESS",status="200",uri="/api/hello",} 0.0
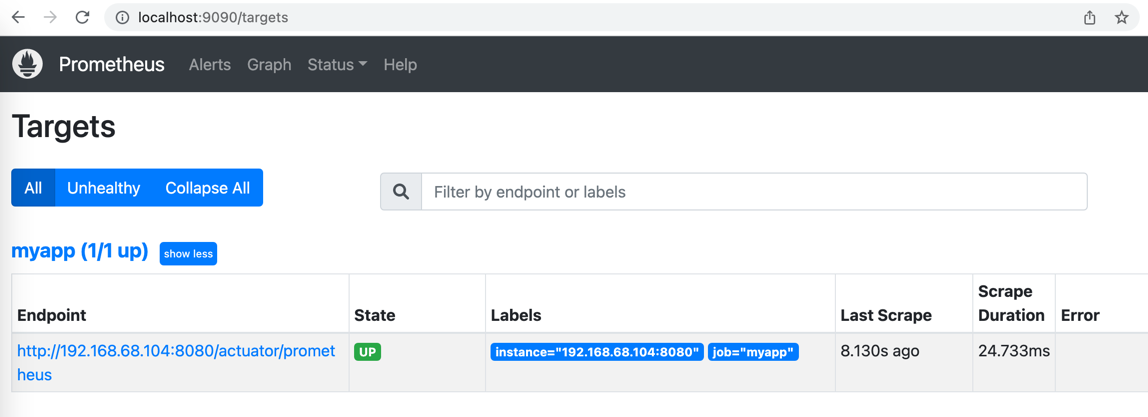
Open Prometheus url: http://localhost:9090
Prometheus should now start pulling data from the spring application. Click on status -> targets on prometheus dashboard to confirm that endpoint is up.
Query the metric hello_api_count_total and view as graph
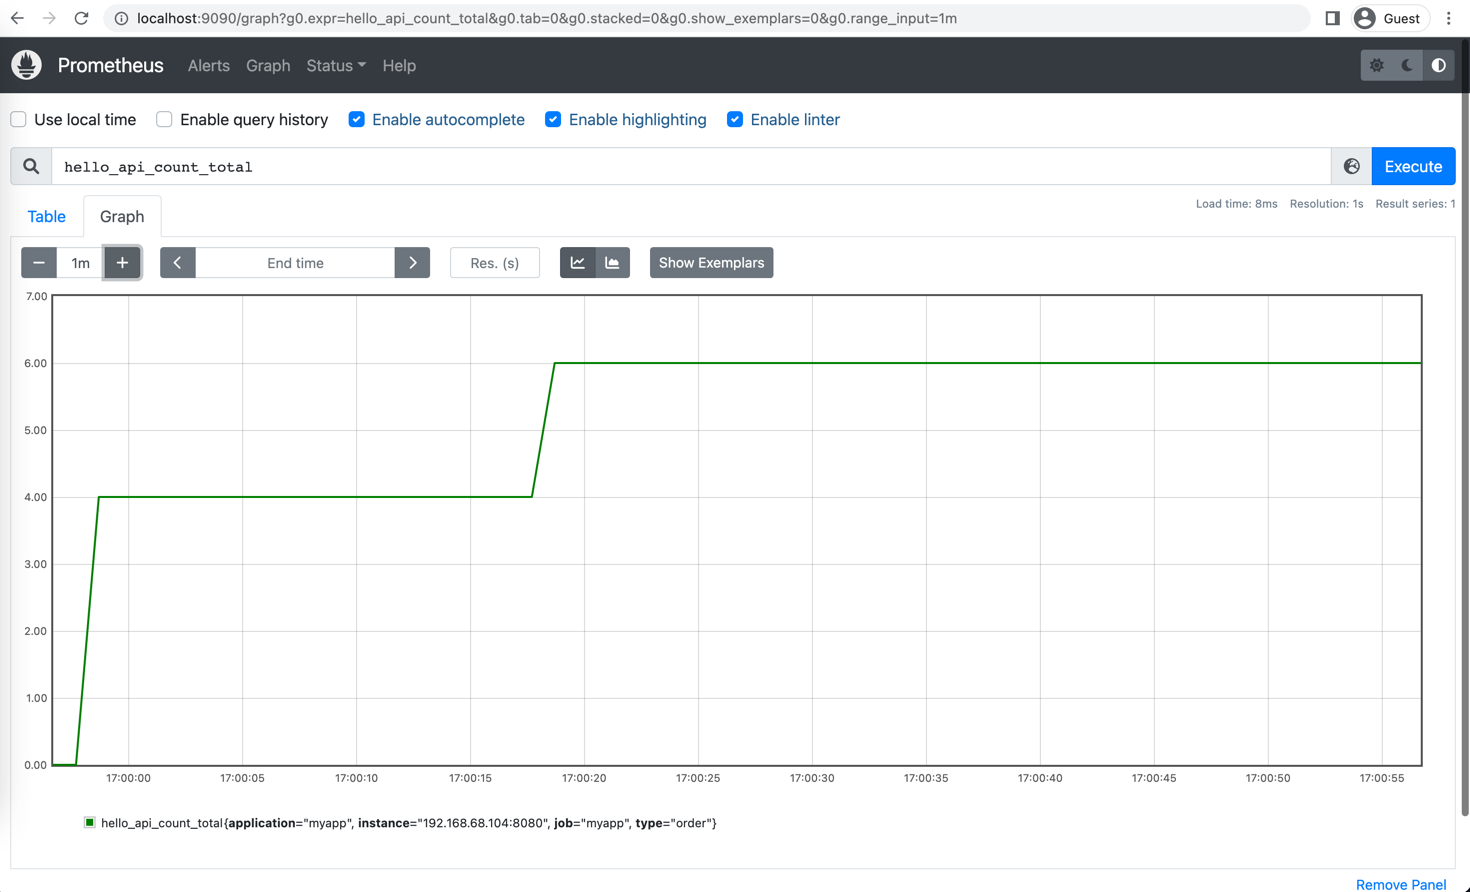
The dashboard in Prometheus is minimal, to add more complex dashboard and visualization you can look at Grafana.
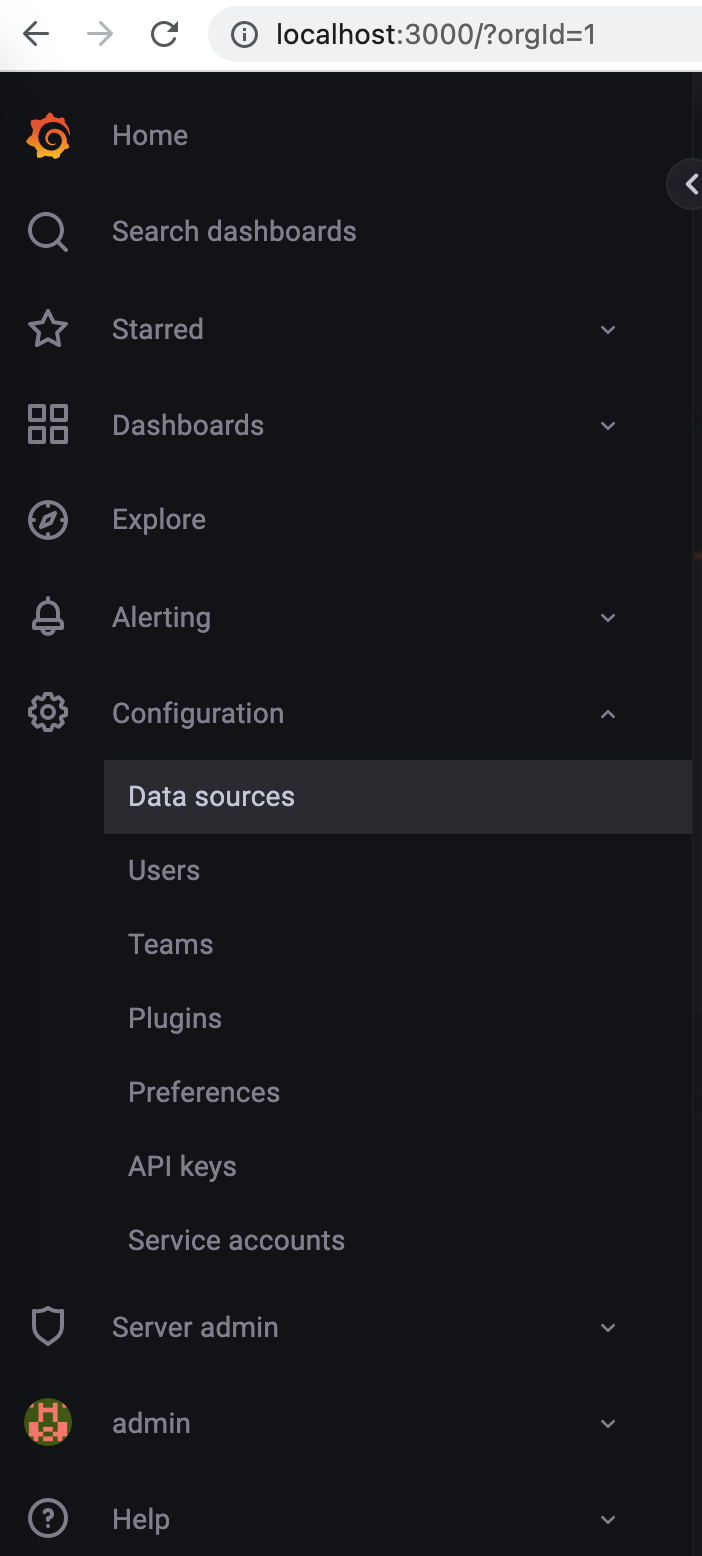
Open Grafana url: http://localhost:3000/
Login, you will need to change the password on first login
1user: admin
2password: admin
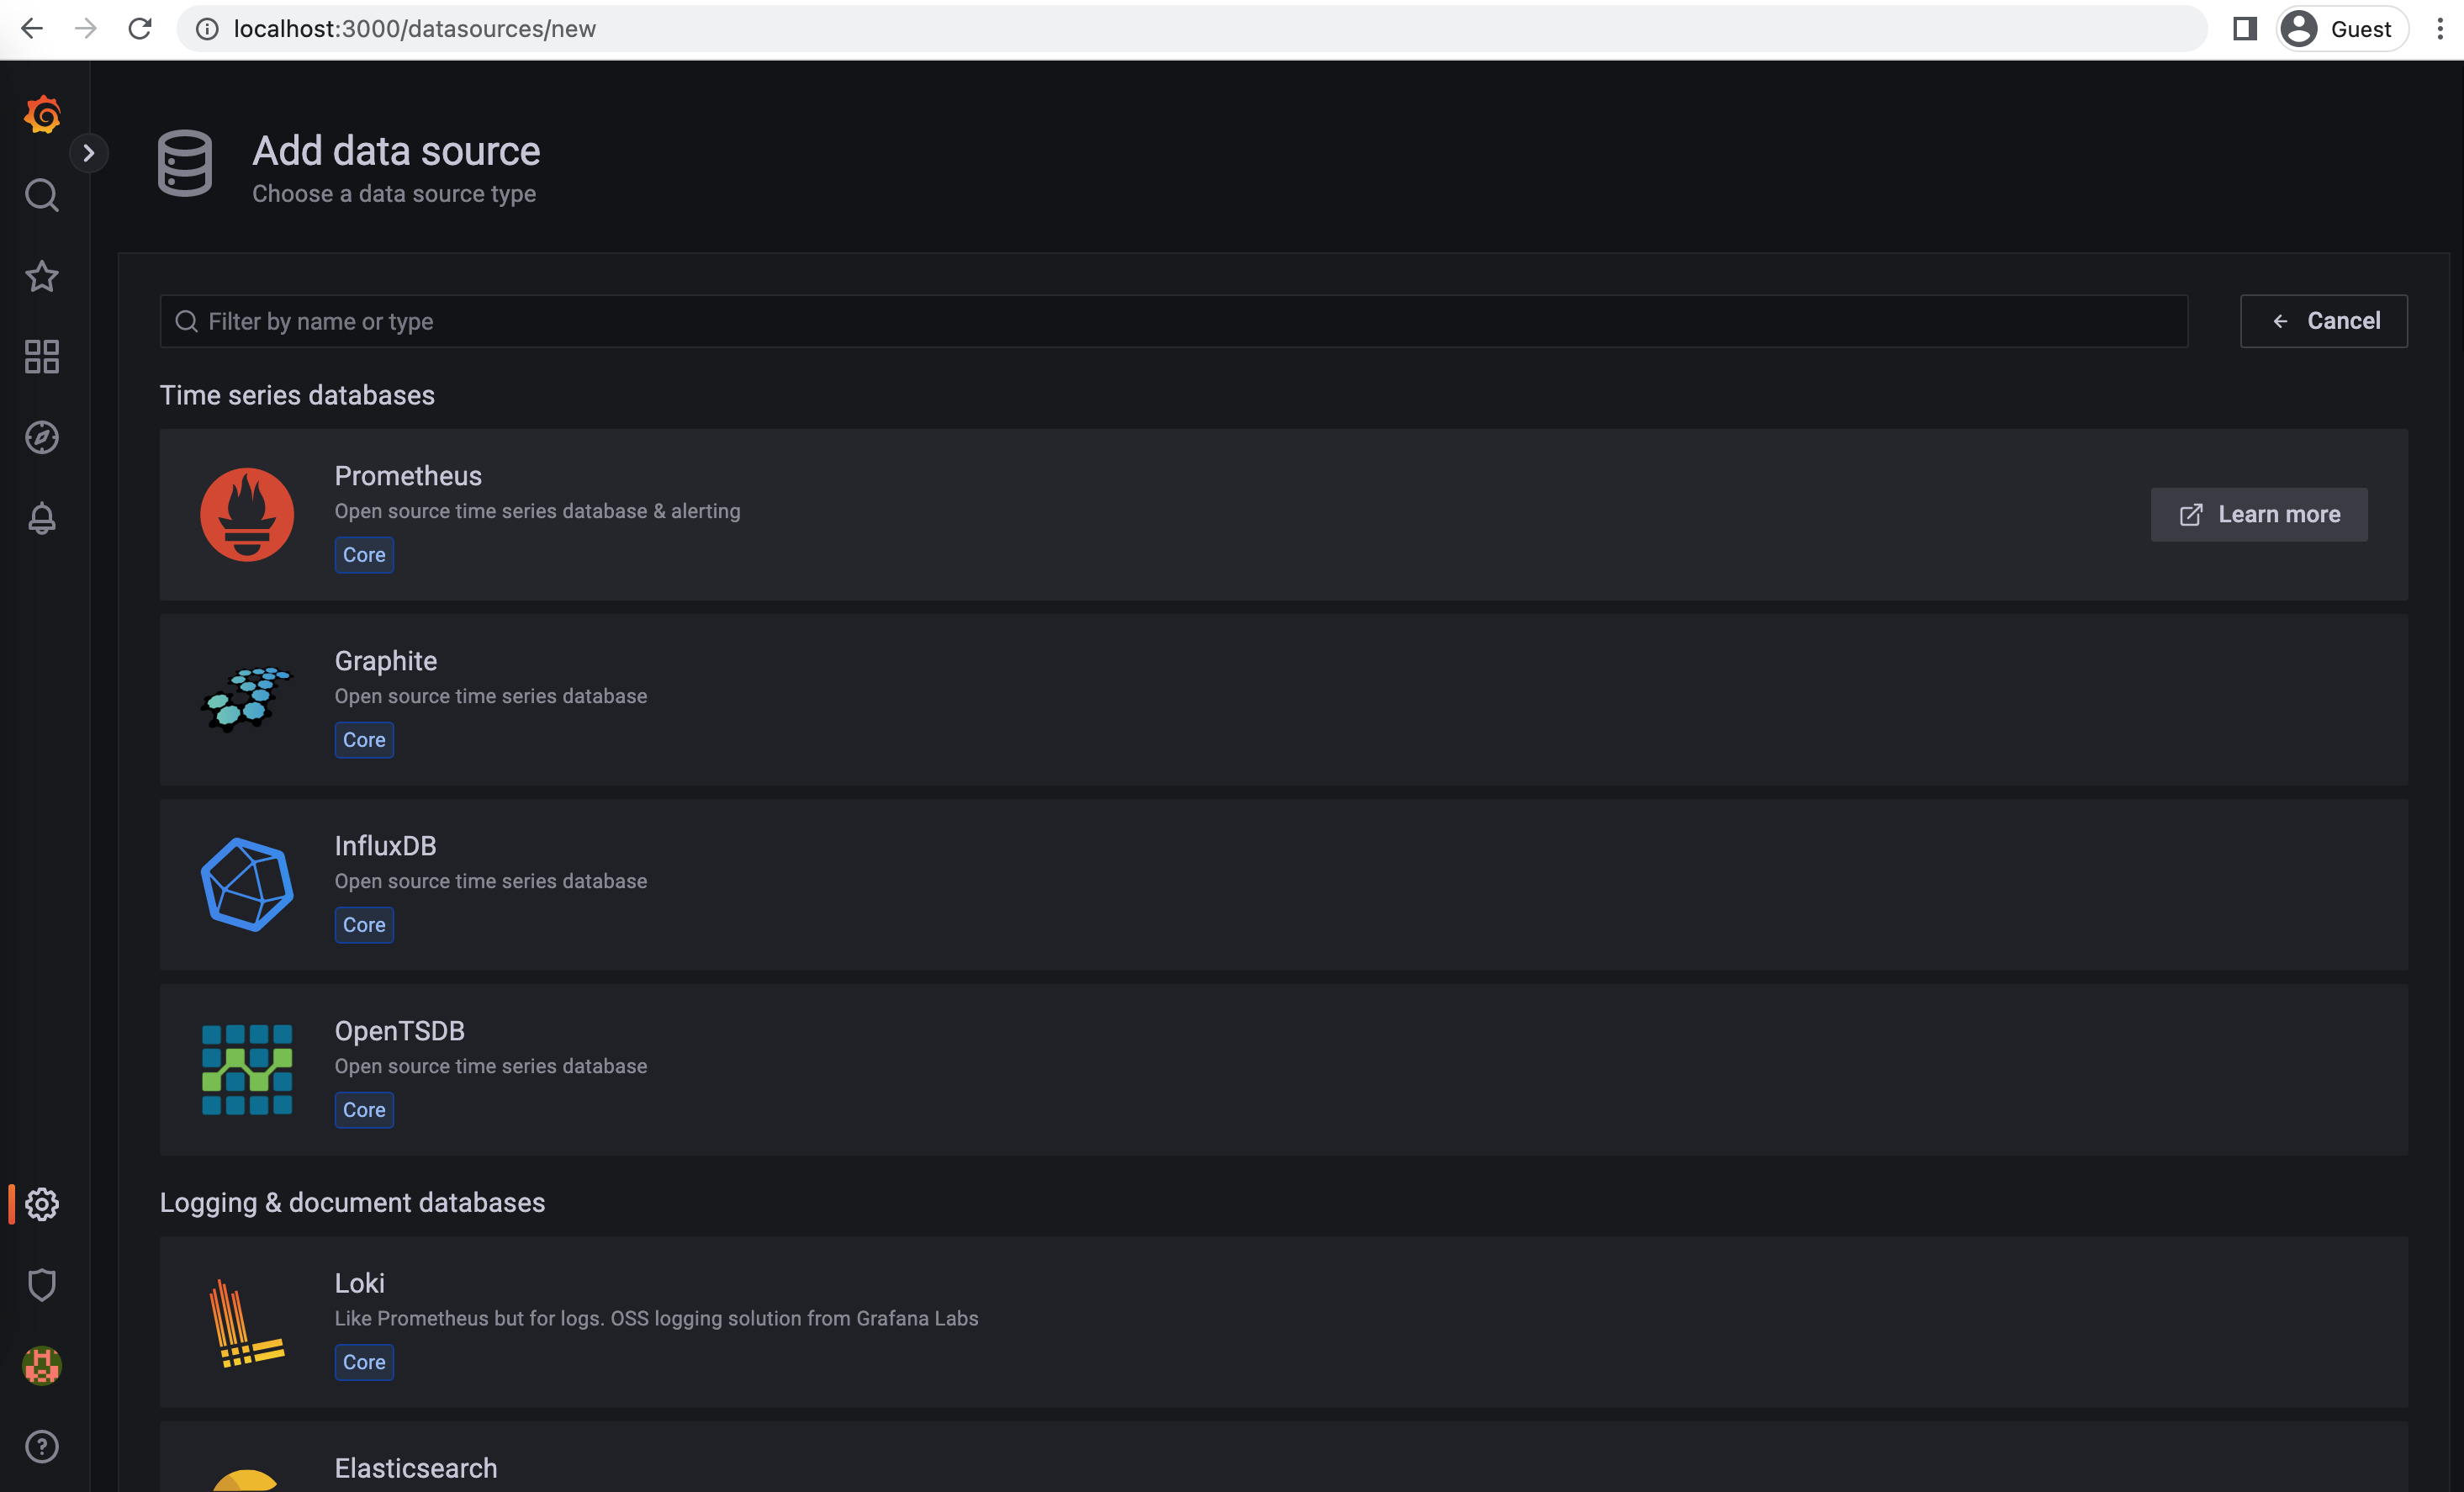
Add the prometheus data source, make sure its the ip address of your system, dont add localhost
http://IP-ADDRESS:9090

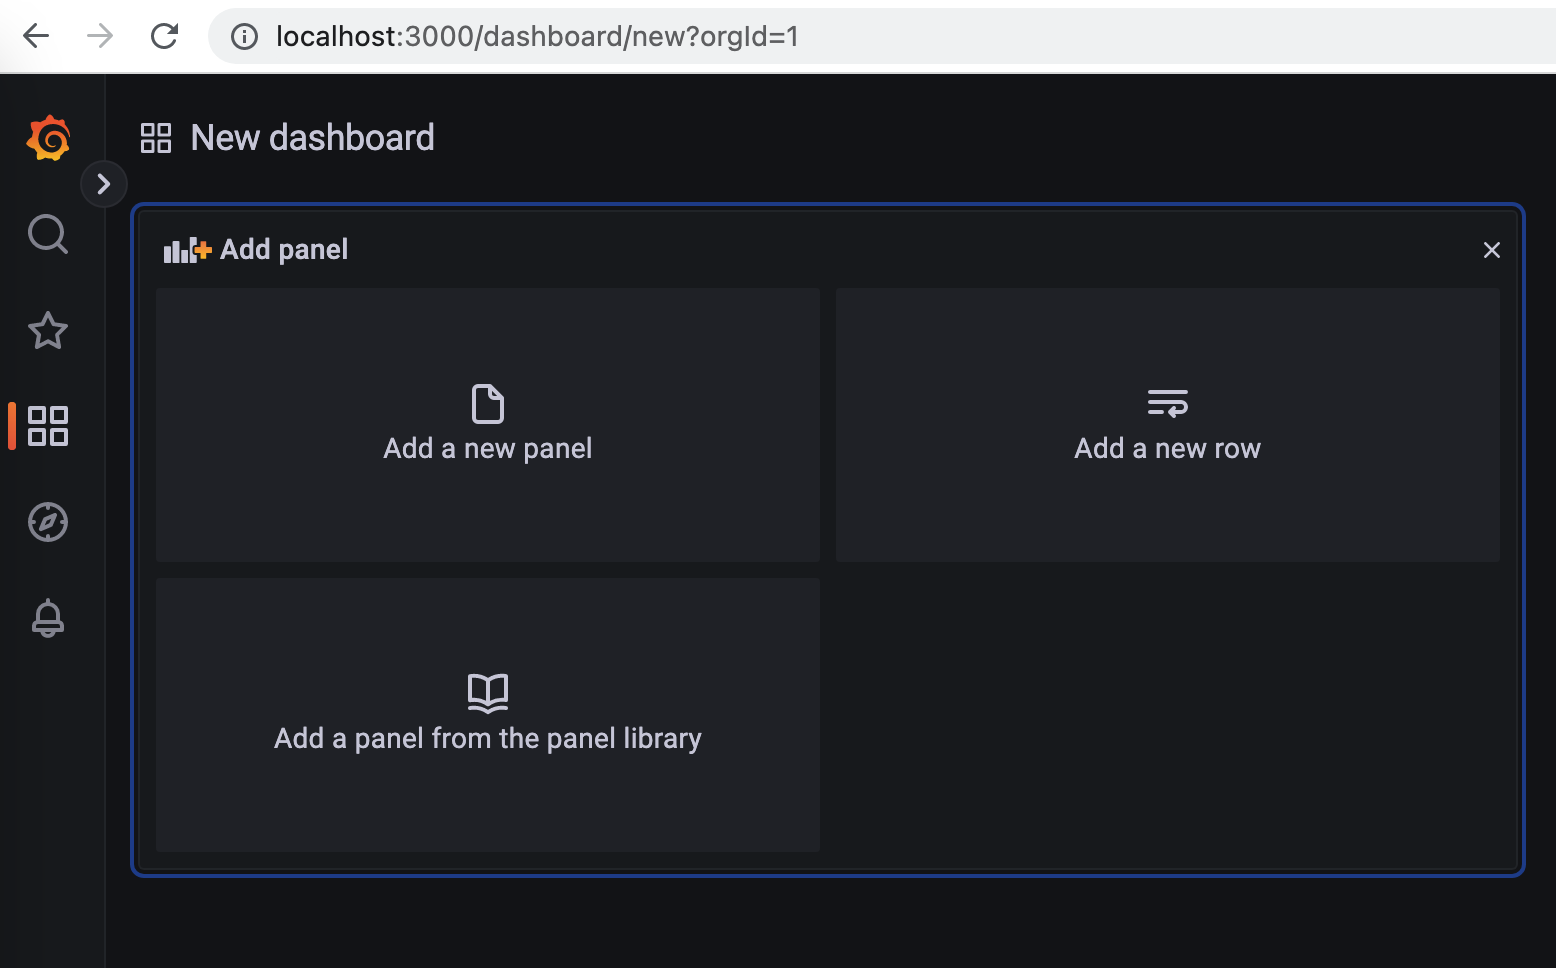
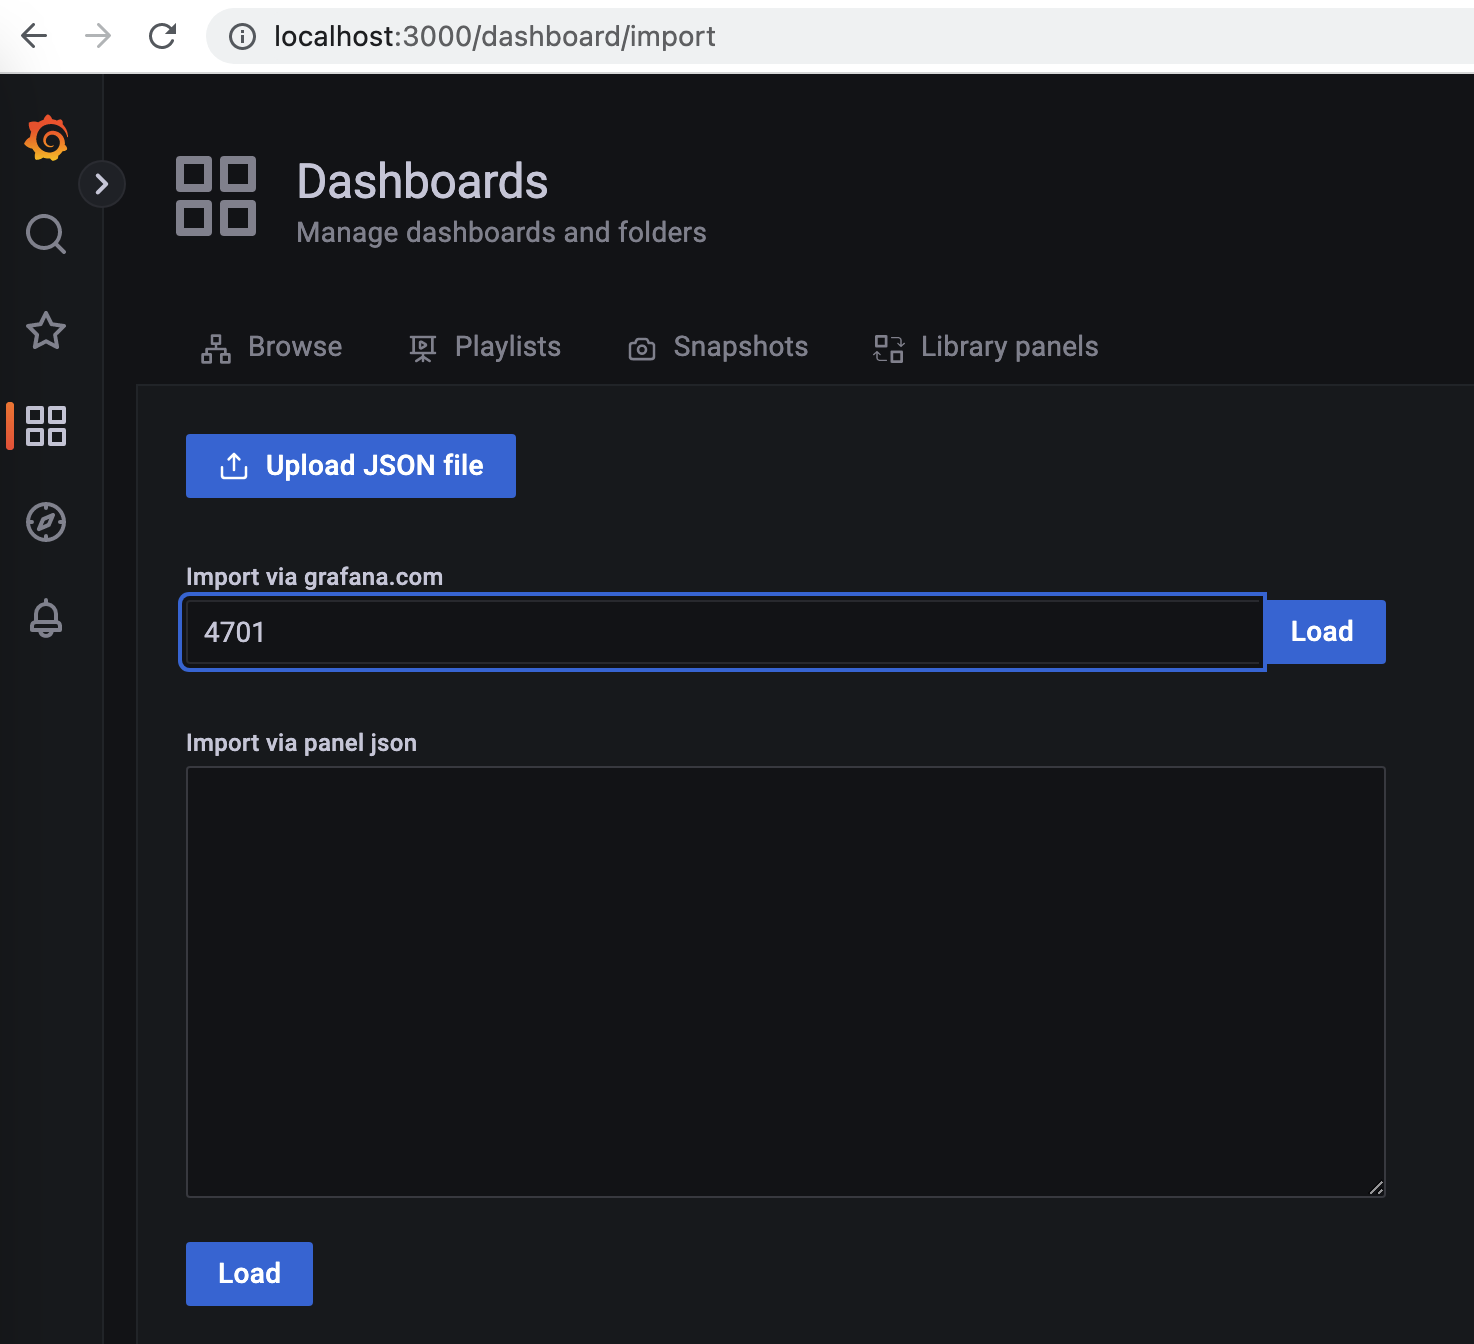
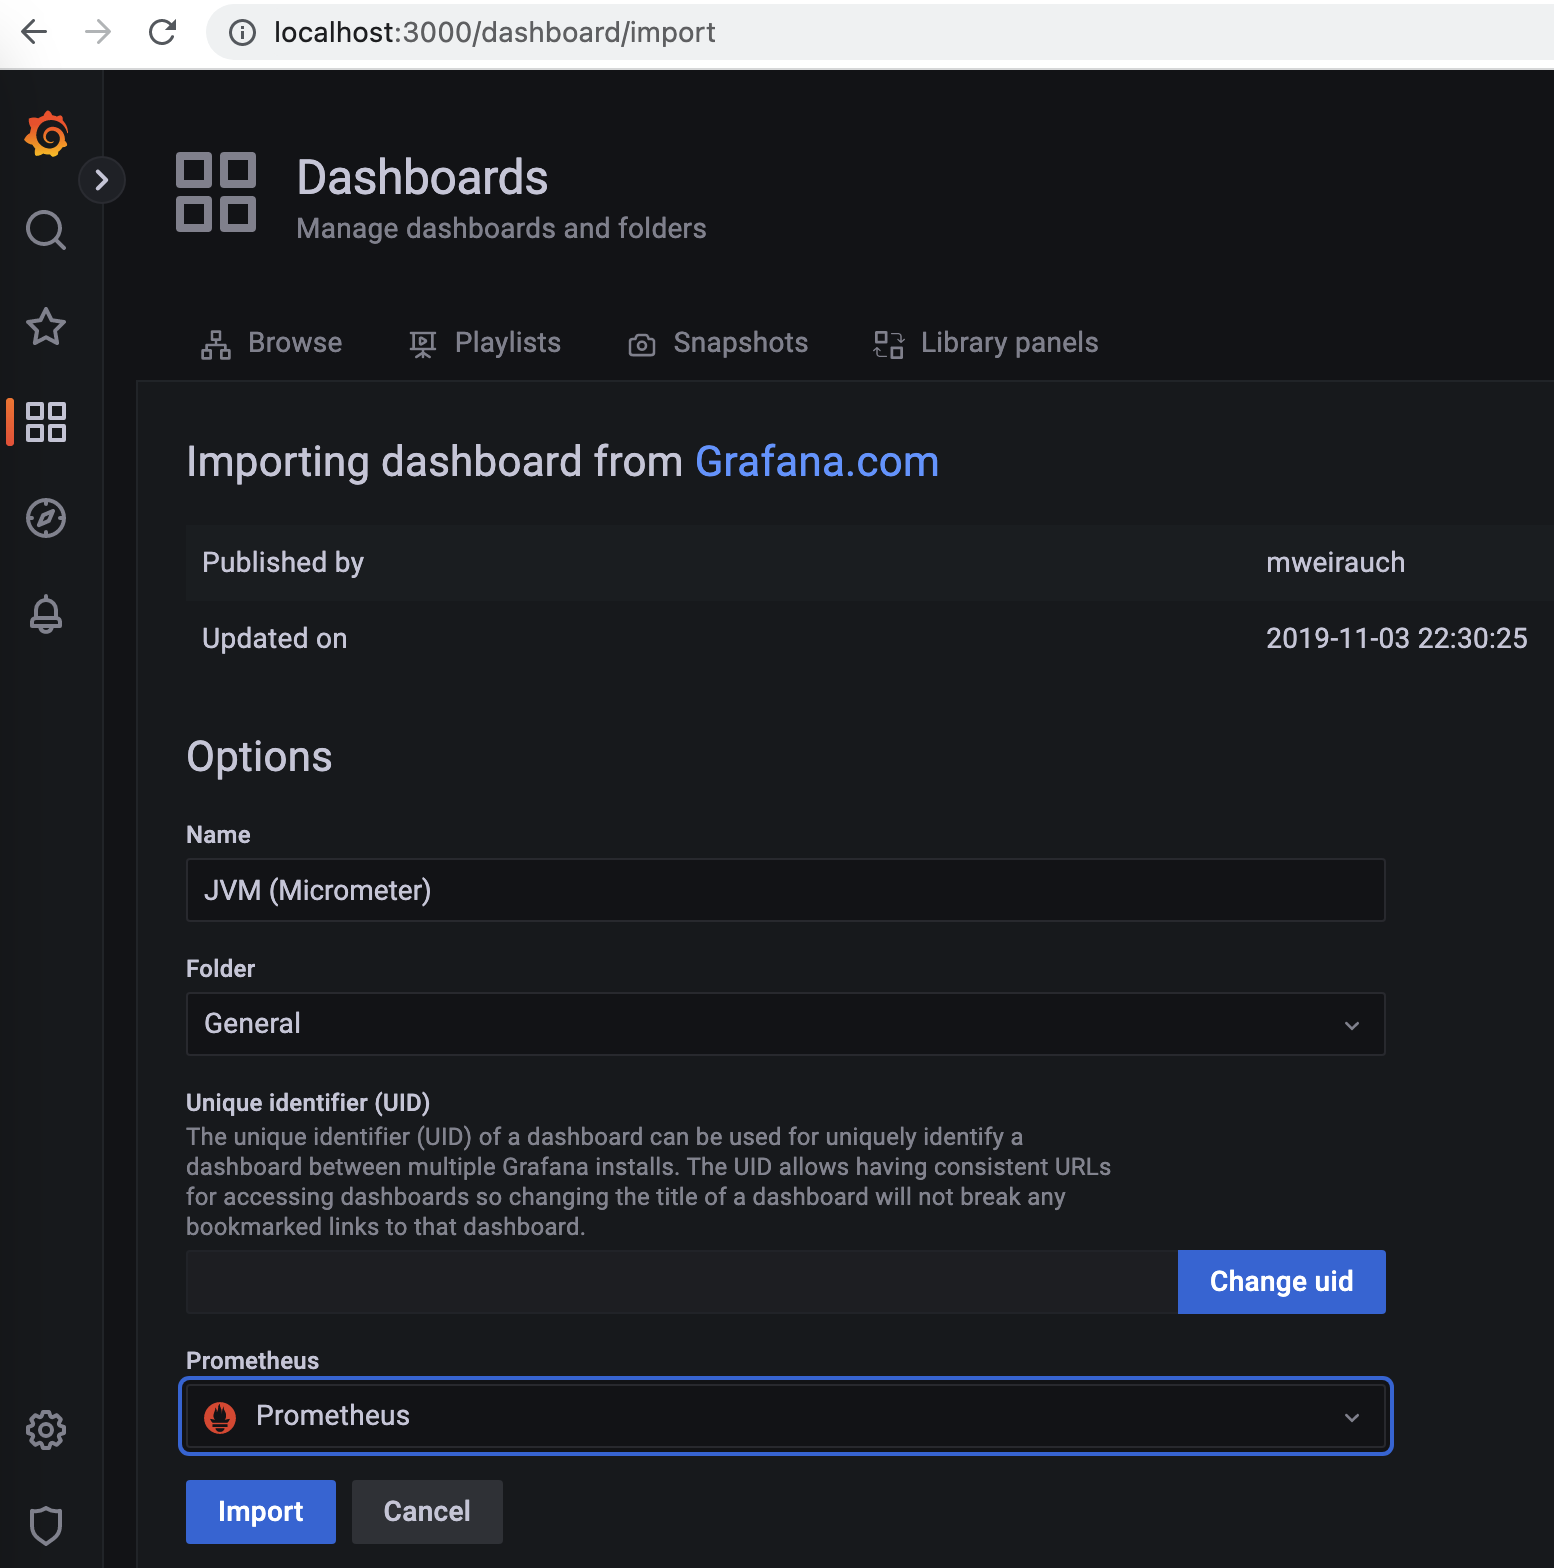
There are existing grafana dashboards that can be imported. Import a dashboard, Download the json file or copy the ID of the dashboard for micrometer dashboard.
https://grafana.com/dashboards/4701
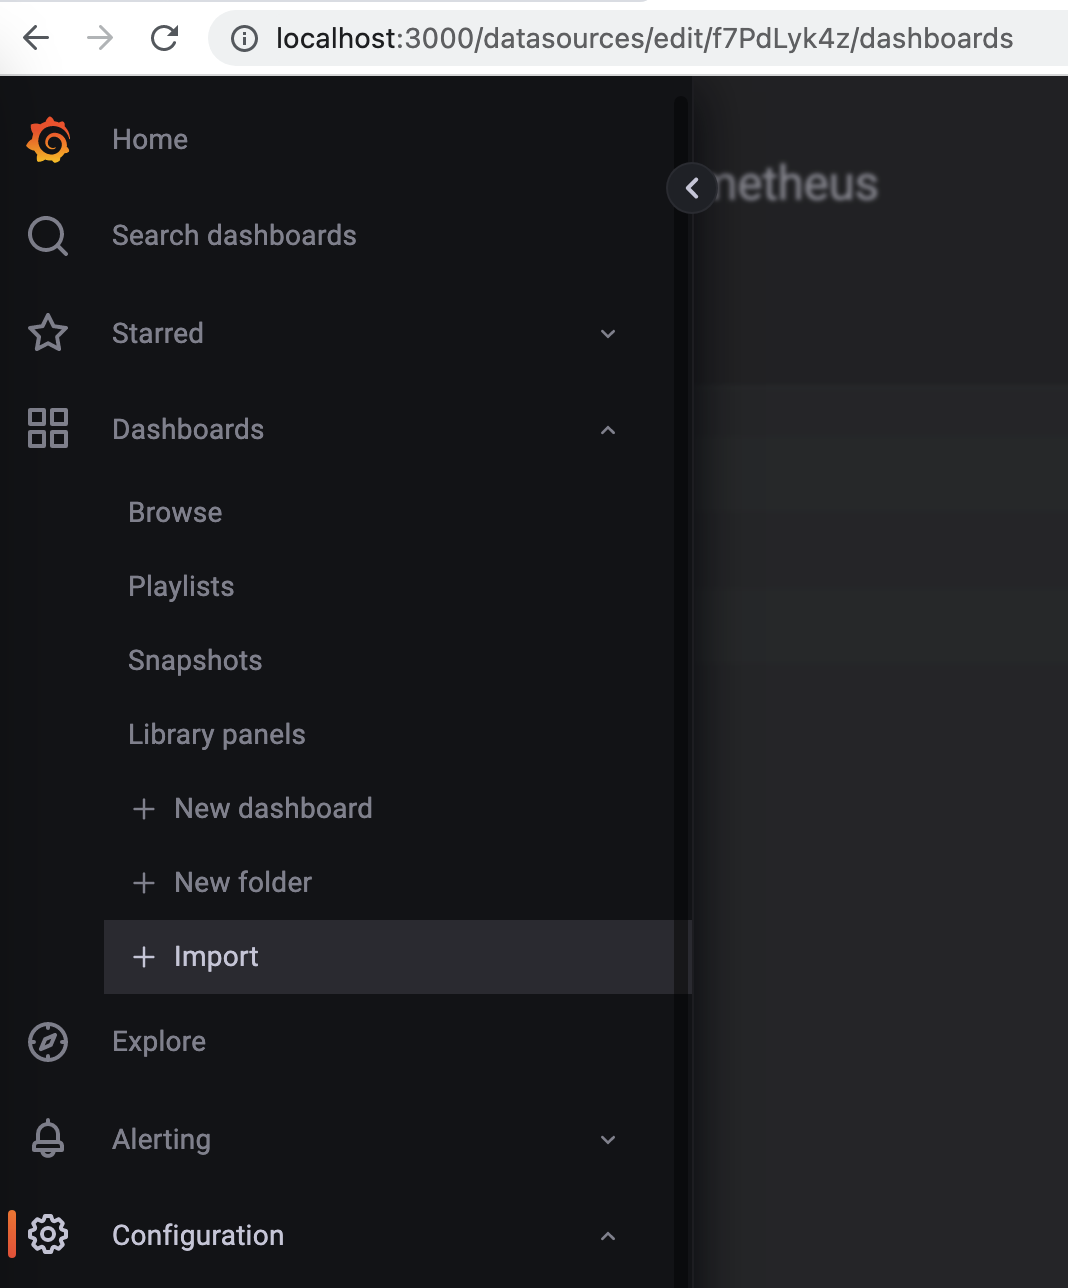
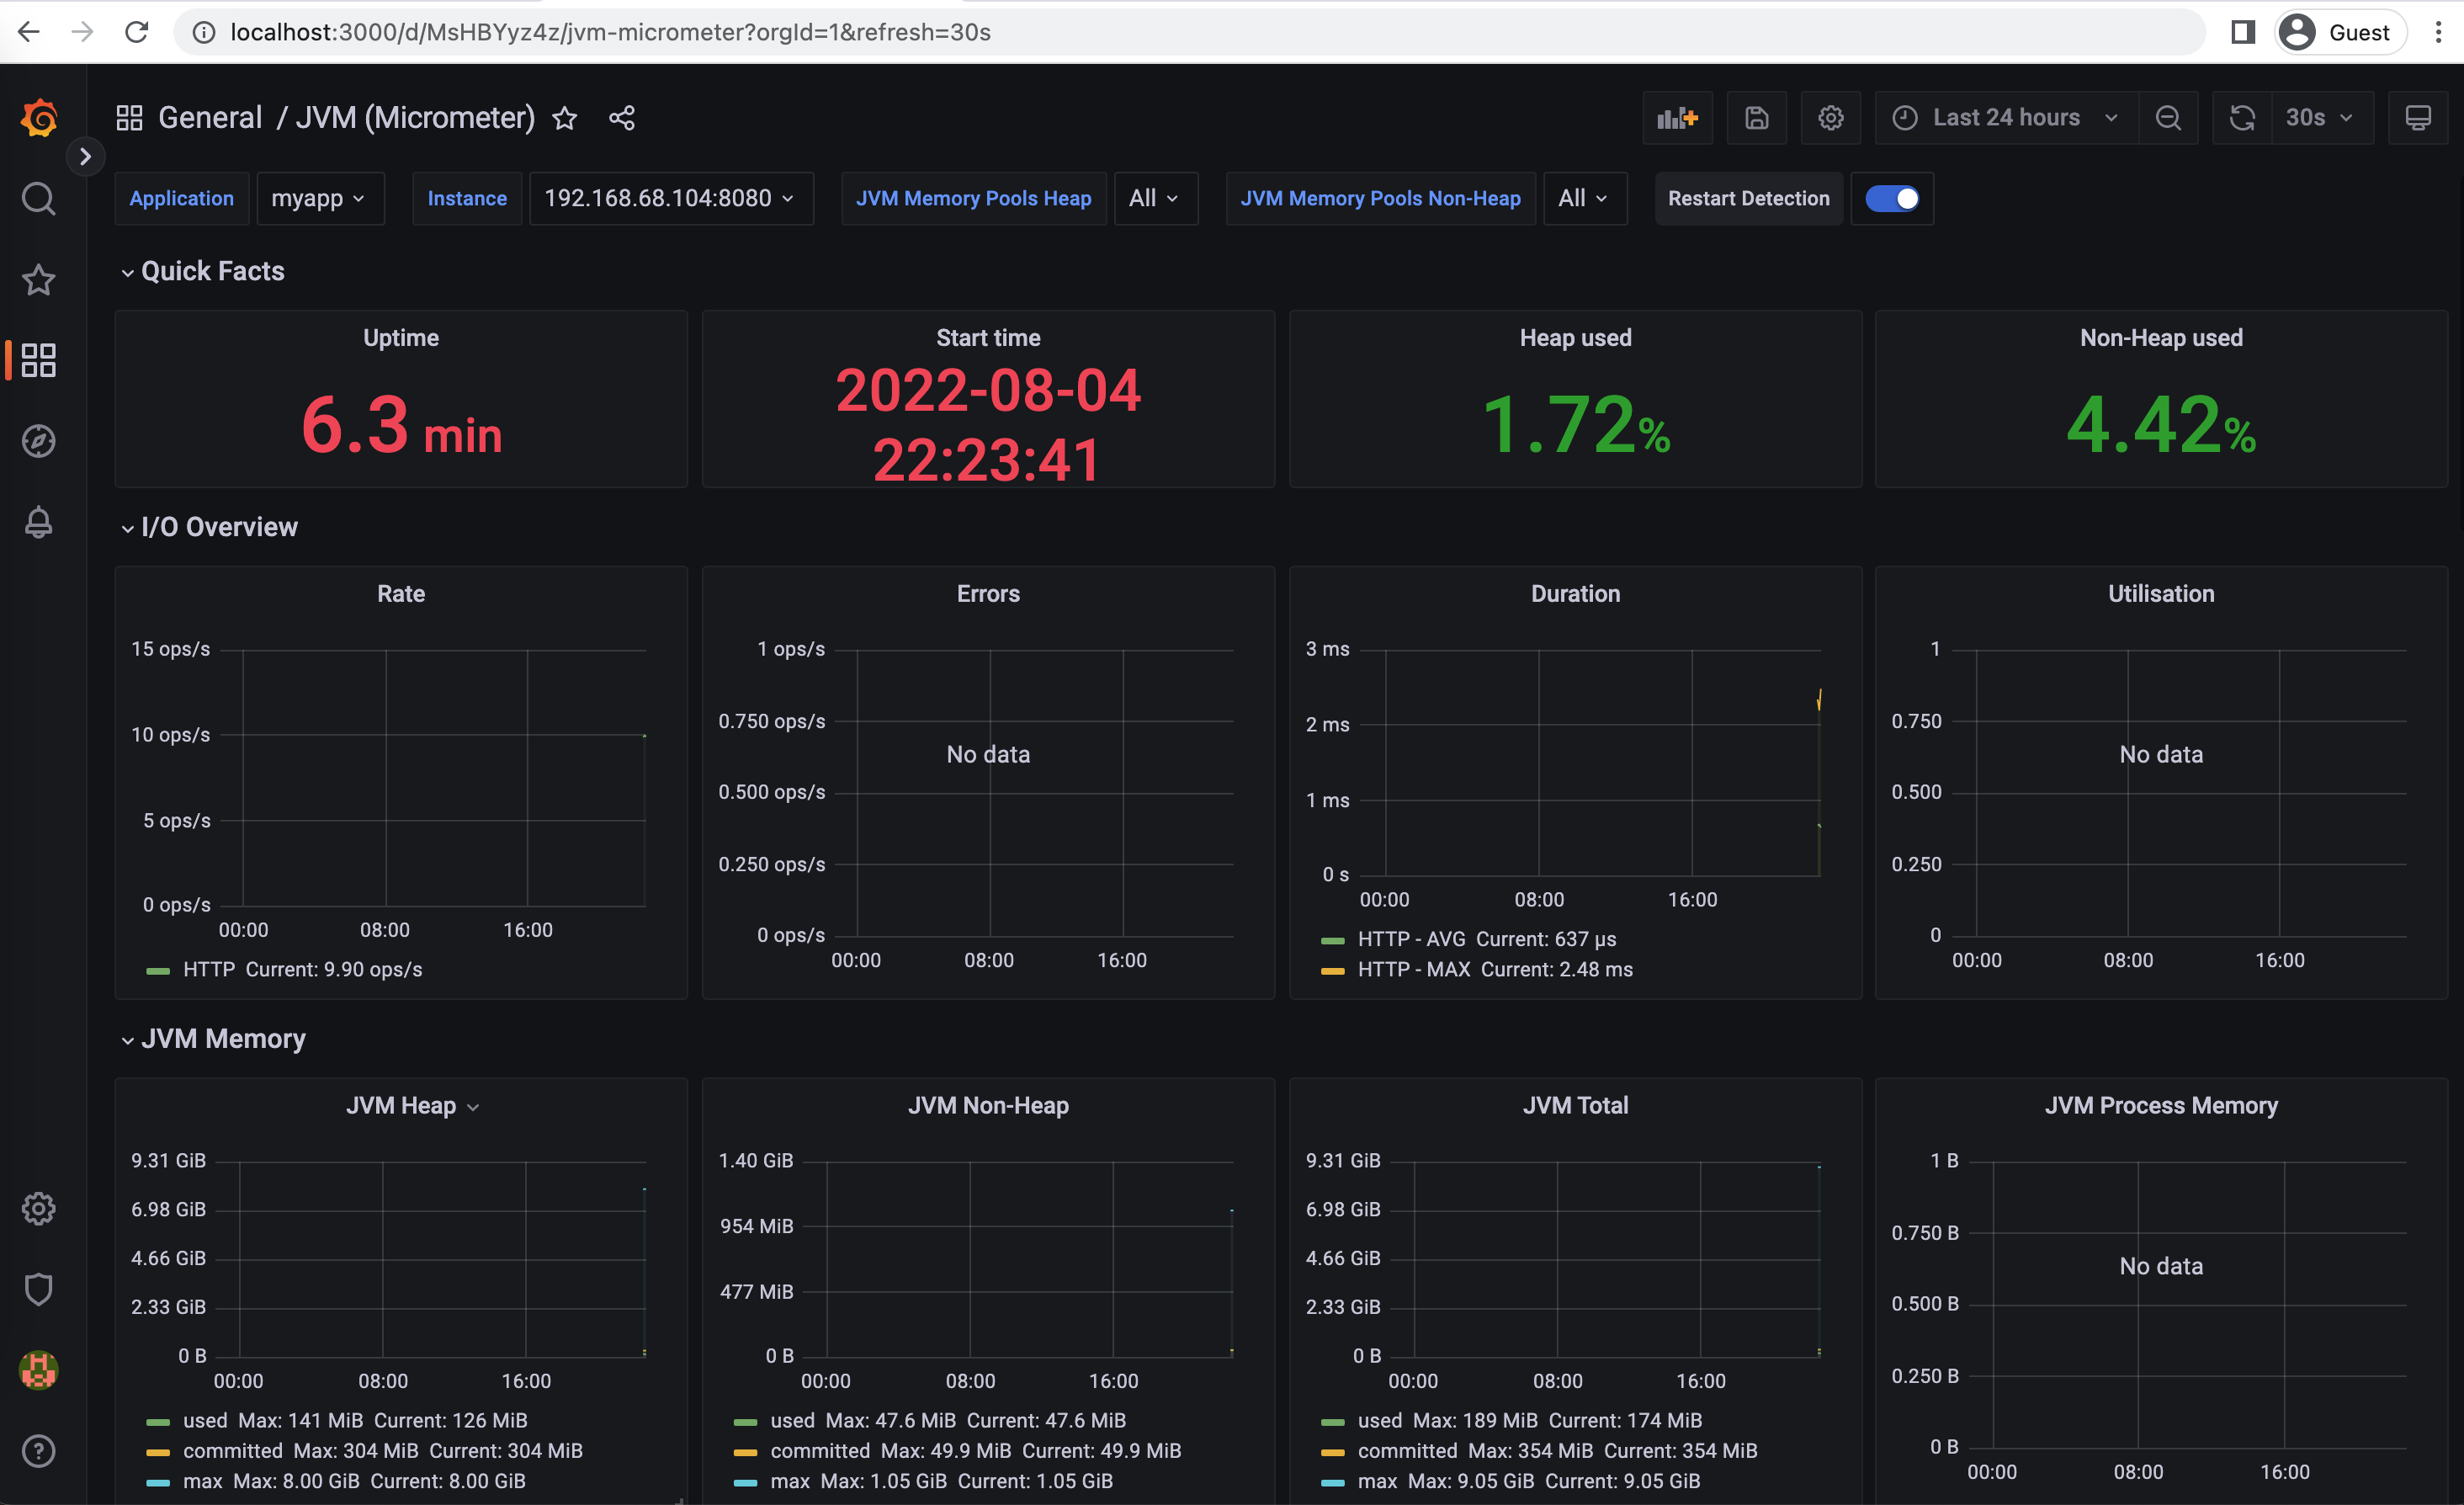
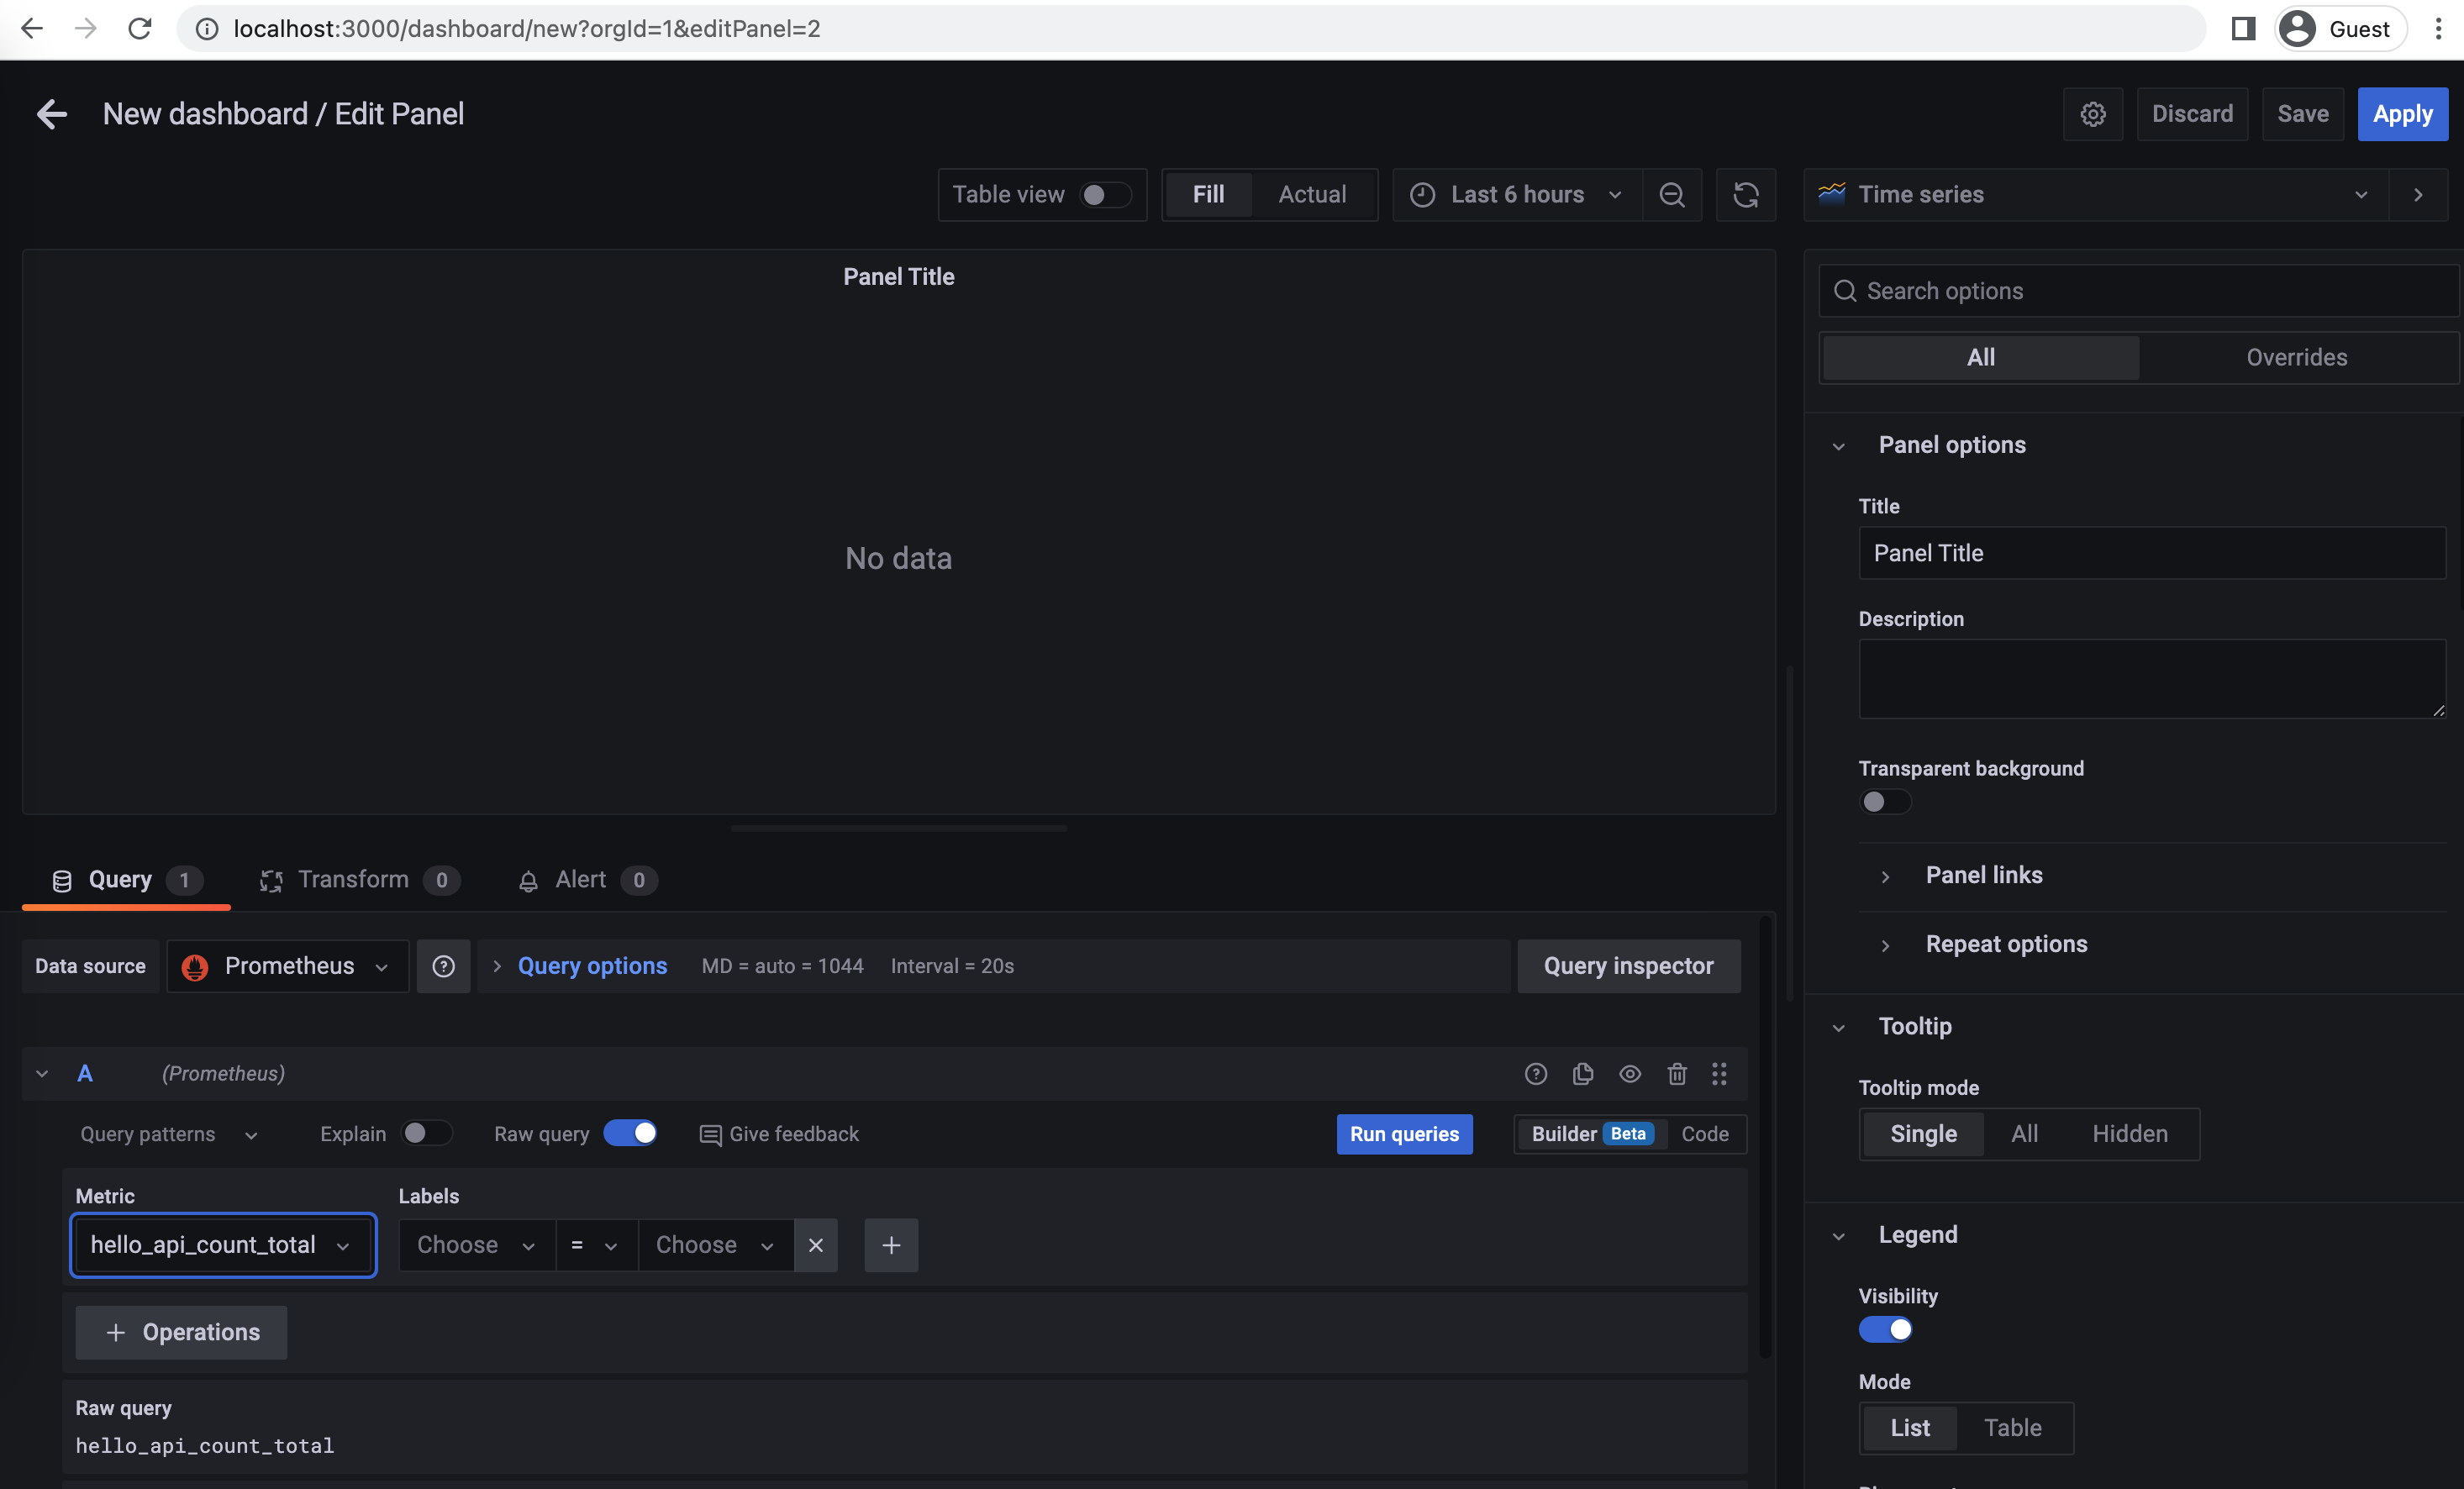
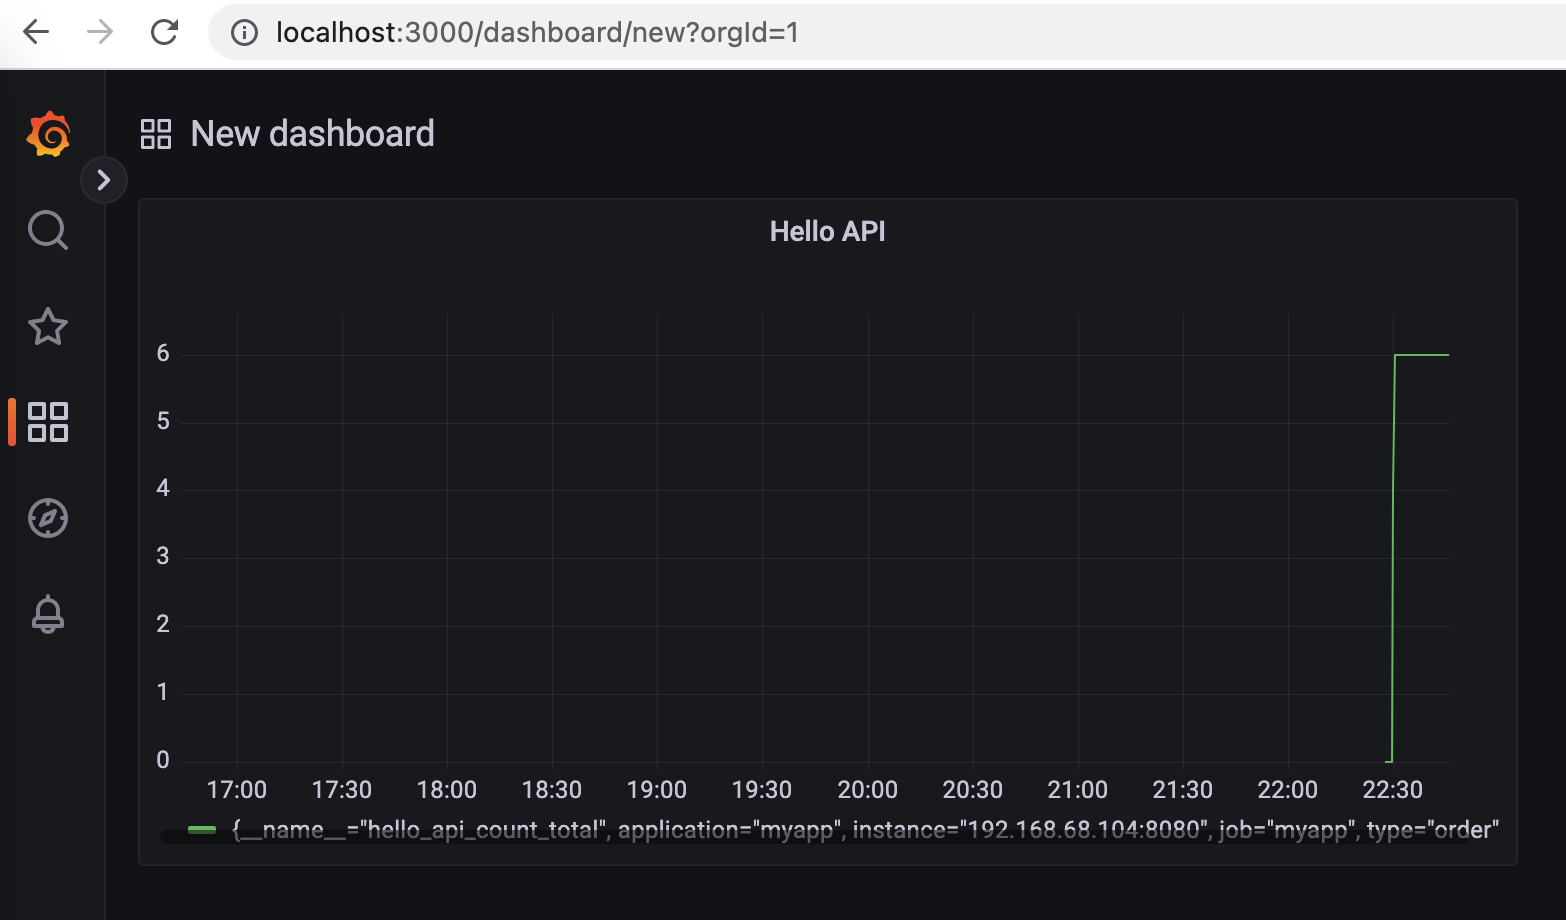
Create a custom dashboard, Add a new panel, add 'hello_api_count_total' metric in the query, save the dashboard.