Spring Boot - Observability
Overview
Spring Boot Observability
Github: https://github.com/gitorko/project71
Application monitoring can be classified into
- Observability - Creates metrics, traces, logs that get stored in time-series db and charts are created. eg: Prometheus, Grafana, OpenTelemetry, Jaeger, Zipkin
- APM (Application Performance Management) - Runs an agents in the jvm that instruments the bytecode and sends metrics to a remote server, focuses on performance and user experience in the application layer. eg: New Relic, Datadog APM, AppDynamics, Dynatrace, Elastic APM
- Monitoring - Checks endpoint uri to monitor health (cpu, memory) infrastructure-centric for alerting. eg: Nagios, Prometheus
Observability
Observability is the ability to observe the internal state of a running system from the outside. Observability has 3 pillars
- Metrics: Quantitative data about system performance (e.g., CPU usage, request count, error rates) eg:
spring-boot-starter-actuator. - Logs: Event-based data for tracking specific actions and events with correlation/span id (e.g., application logs) eg:
micrometer-tracing-bridge-brave. - Traces: Distributed tracing for tracking the path of a request across services (e.g., tracing API calls) eg:
zipkin-reporter-brave.
Various tools that help in observability
- Prometheus - An open-source systems monitoring and alerting tool. Prometheus scrapes/collects metrics from an endpoint at regular intervals. Stores the data in a time series database.
- Grafana - A visualization tool, can pull data from multiple sources (Prometheus) and shows them in graphs.
- Zipkin - A distributed tracing system. It helps gather timing data needed to troubleshoot latency problems in service architectures.
Micrometer is a vendor-neutral instrumentation library that allows you to collect metrics and traces for observability.
- Metrics Collection - Supports Prometheus, Graphite, Datadog, New Relic, etc.
- Tracing Support - Used with Brave (Zipkin), OpenTelemetry, Wavefront, etc.
- Logging Context Propagation - Adds tracing IDs in logs for better debugging
- Spring Integration - Works out of the box with Spring Boot’s Actuator
Spring Observability internally uses Micrometer, so in Spring Boot 3+, you should use Spring Observability APIs for new projects
Logging
Tracing adds spans/traces to all logs.
Metrics
A Meter consists of a name and tags, There are 4 main types of meters.
- Timers - Time taken to run something.
- Counter - Number of time something was run.
- Gauge - Report data when observed. Gauges can be useful when monitoring stats of cache, collections
- Distribution summary - Distribution of events.
- Binders - Built-in binders to monitor the JVM, caches, ExecutorService, and logging services
Distributed Tracing
Spring Boot samples only 10% of requests to prevent overwhelming the trace backend. Change probability to 1.0 so that every request is sent to the trace backend.
1management:
2  tracing:
3    sampling:
4      probability: 1.0
Code
  1package com.demo.project71.service;
  2
  3import java.util.Random;
  4import java.util.concurrent.TimeUnit;
  5
  6import com.demo.project71.config.RegistryConfig;
  7import io.micrometer.core.annotation.Timed;
  8import io.micrometer.observation.Observation;
  9import io.micrometer.observation.ObservationRegistry;
 10import io.micrometer.observation.annotation.Observed;
 11import lombok.RequiredArgsConstructor;
 12import lombok.SneakyThrows;
 13import lombok.extern.slf4j.Slf4j;
 14import org.springframework.context.annotation.Configuration;
 15import org.springframework.scheduling.annotation.Async;
 16import org.springframework.scheduling.annotation.EnableAsync;
 17import org.springframework.stereotype.Service;
 18
 19@Service
 20@RequiredArgsConstructor
 21@Slf4j
 22@Configuration
 23@EnableAsync
 24public class GreetService {
 25
 26    final ObservationRegistry observationRegistry;
 27
 28    public String sayHello1() {
 29        return Observation.createNotStarted("sayHello1", observationRegistry).contextualName("greet.hello-1").observe(() -> {
 30            log.info("Hello World 1!");
 31            return "Hello World 1!";
 32        });
 33    }
 34
 35    @Observed(contextualName = "greet.hello-2")
 36    public String sayHello2() {
 37        log.info("Hello World 2!");
 38        return "Hello World 2!";
 39    }
 40
 41    public String sayHello3() {
 42        return Observation.createNotStarted("greet.hello-3", observationRegistry).observe(this::sayHello3_NoObs);
 43    }
 44
 45    public String sayHello3_NoObs() {
 46        log.info("Hello World 3!");
 47        return "Hello World 3!";
 48    }
 49
 50    @Timed("greet.sayHello4")
 51    @SneakyThrows
 52    public String sayHello4() {
 53        RegistryConfig.helloApiCounter.increment();
 54        log.info("Hello World 4!");
 55        int sleepTime = new Random().nextInt(5);
 56        log.info("Sleeping for seconds: {}", sleepTime);
 57        TimeUnit.SECONDS.sleep(sleepTime);
 58        return "Hello World 4!";
 59    }
 60
 61    @SneakyThrows
 62    public String sayHello5() throws InterruptedException {
 63        log.info("sayHello5 start - Original span");
 64        inner1();
 65        inner2();
 66        log.info("sayHello5 end - Original span");
 67        return "Hello World 5!";
 68    }
 69
 70    public void inner1() {
 71        Observation.createNotStarted("inner1", observationRegistry).observe(() -> {
 72            log.info("Inner1");
 73        });
 74    }
 75
 76    public void inner2() {
 77        Observation.start("inner2", observationRegistry).observe(() -> {
 78            log.info("Inner2");
 79        });
 80    }
 81
 82    /**
 83     * You can add additional values
 84     * Low cardinality tags will be added to metrics and traces, while high cardinality tags will only be added to traces.
 85     */
 86    public String sayHello6() {
 87        return Observation.createNotStarted("sayHello1", observationRegistry)
 88                .lowCardinalityKeyValue("locale", "en-US")
 89                .highCardinalityKeyValue("userId", "42")
 90                .contextualName("greet.hello-6")
 91                .observe(() -> {
 92                    log.info("Hello World 6!");
 93                    return "Hello World 6!";
 94                });
 95    }
 96
 97    @Async
 98    @SneakyThrows
 99    public void asyncHello() {
100        log.info("Start Async Method");
101        TimeUnit.SECONDS.sleep(1);
102        log.info("End Async Method");
103    }
104}
 1package com.demo.project71.config;
 2
 3import io.micrometer.core.aop.TimedAspect;
 4import io.micrometer.core.instrument.Counter;
 5import io.micrometer.core.instrument.MeterRegistry;
 6import io.micrometer.core.instrument.Metrics;
 7import jakarta.annotation.PostConstruct;
 8import org.springframework.beans.factory.annotation.Value;
 9import org.springframework.boot.actuate.autoconfigure.metrics.MeterRegistryCustomizer;
10import org.springframework.context.annotation.Bean;
11import org.springframework.context.annotation.Configuration;
12import org.springframework.context.annotation.EnableAspectJAutoProxy;
13
14@Configuration
15@EnableAspectJAutoProxy
16public class RegistryConfig {
17
18    public static Counter helloApiCounter;
19
20    /**
21     * Applies common tags on all Meters
22     */
23    @Bean
24    MeterRegistryCustomizer<MeterRegistry> configurer(@Value("${spring.application.name}") String applicationName) {
25        return registry -> registry.config().commonTags("application", applicationName);
26    }
27
28    /**
29     * Enables @Timed annotation
30     */
31    @Bean
32    public TimedAspect timedAspect(MeterRegistry registry) {
33        return new TimedAspect(registry);
34    }
35
36    /**
37     * Creates a Meter
38     */
39    @PostConstruct
40    public void postInit() {
41        helloApiCounter = Metrics.counter("hello.api.count", "type", "order");
42    }
43} 1package com.demo.project71.config;
2
3import java.util.concurrent.Executor;
4import java.util.concurrent.Executors;
5
6import io.micrometer.context.ContextExecutorService;
7import io.micrometer.context.ContextSnapshotFactory;
8import lombok.RequiredArgsConstructor;
9import org.springframework.context.annotation.Configuration;
10import org.springframework.scheduling.annotation.AsyncConfigurer;
11
12@Configuration
13@RequiredArgsConstructor
14class ThreadConfig implements AsyncConfigurer {
15
16 @Override
17 public Executor getAsyncExecutor() {
18 return ContextExecutorService.wrap(Executors.newFixedThreadPool(5), ContextSnapshotFactory.builder().build()::captureAll);
19 }
20
21}
Postman
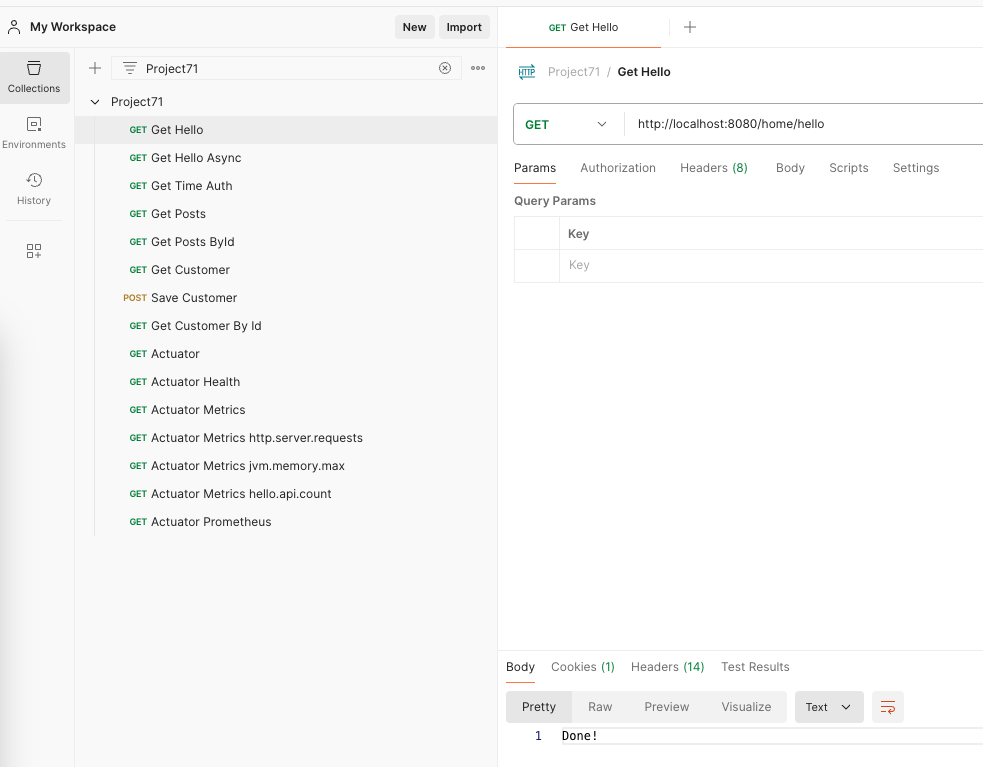
Import the postman collection to postman
Setup
1# Project 71
2
3Spring Observability
4
5[https://gitorko.github.io/spring-boot-observability/](https://gitorko.github.io/spring-boot-observability/)
6
7### Version
8
9Check version
10
11```bash
12$java --version
13openjdk 21.0
14```
15
16### Postgres DB
17
18```
19docker run -p 5432:5432 --name pg-container -e POSTGRES_PASSWORD=password -d postgres:9.6.10
20docker ps
21docker exec -it pg-container psql -U postgres -W postgres
22CREATE USER test WITH PASSWORD 'test@123';
23CREATE DATABASE "test-db" WITH OWNER "test" ENCODING UTF8 TEMPLATE template0;
24grant all PRIVILEGES ON DATABASE "test-db" to test;
25
26docker stop pg-container
27docker start pg-container
28```
29
30### Zipkin
31
32To run zipkin server use the docker command
33
34```bash
35docker run -d -p 9411:9411 --name my-zipkin openzipkin/zipkin
36
37docker stop my-zipkin
38docker start my-zipkin
39```
40
41Login to zipkin UI, wait for few seconds for server to be up.
42
43[http://localhost:9411/zipkin/](http://localhost:9411/zipkin/)
44
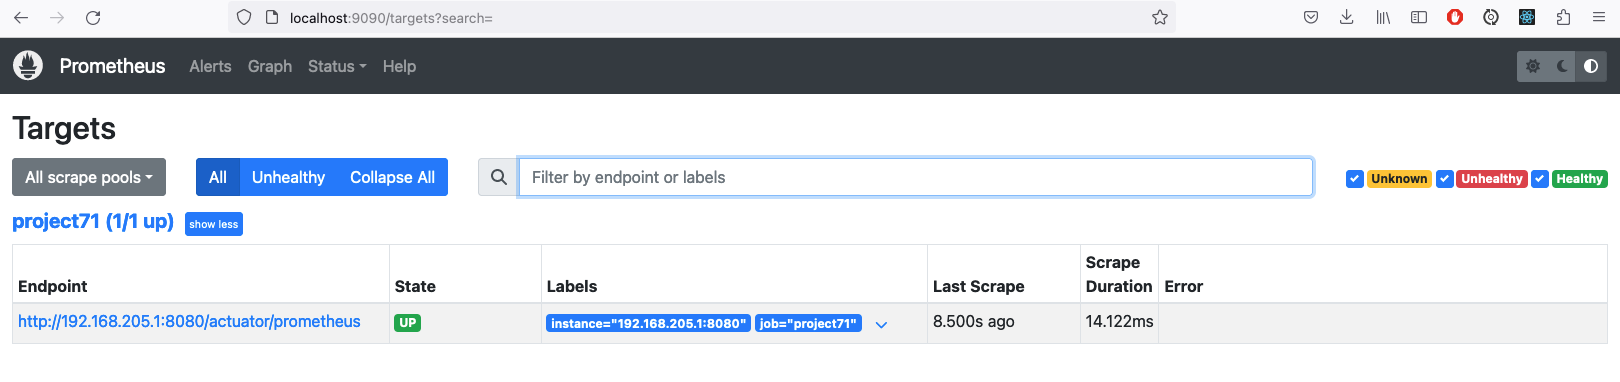
45## Prometheus
46
47Update the target ip-address in the prometheus.yml file, don't use localhost when using docker container
48
49To start the prometheus docker instance build the docker image & run the image.
50
51```bash
52cd project71
53docker build -f docker/Dockerfile --force-rm -t my-prometheus .
54docker run -d -p 9090:9090 --name my-prometheus my-prometheus
55
56docker stop my-prometheus
57docker start my-prometheus
58```
59
60[http://localhost:9090](http://localhost:9090)
61
62## Grafana
63
64To start the grafana docker instance run the command.
65
66```bash
67docker run --name my-grafana -d -p 3000:3000 grafana/grafana
68
69docker stop my-grafana
70docker start my-grafana
71```
72
73[http://localhost:3000](http://localhost:3000)
74
75```
76user: admin
77password: admin
78```
79
80### Dev
81
82To run the code.
83
84```bash
85./gradlew clean build
86./gradlew bootRun
87```
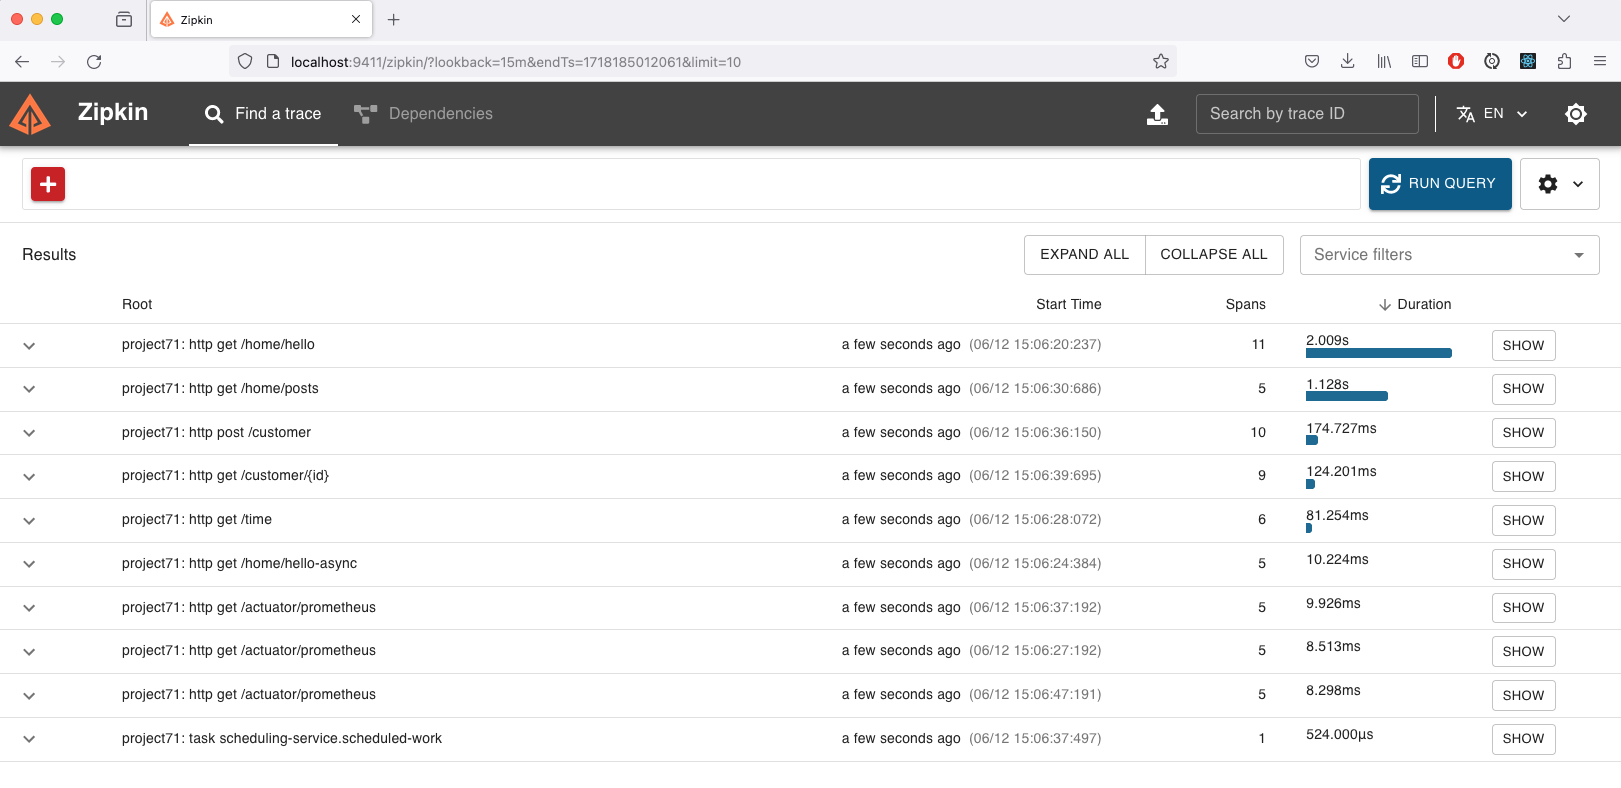
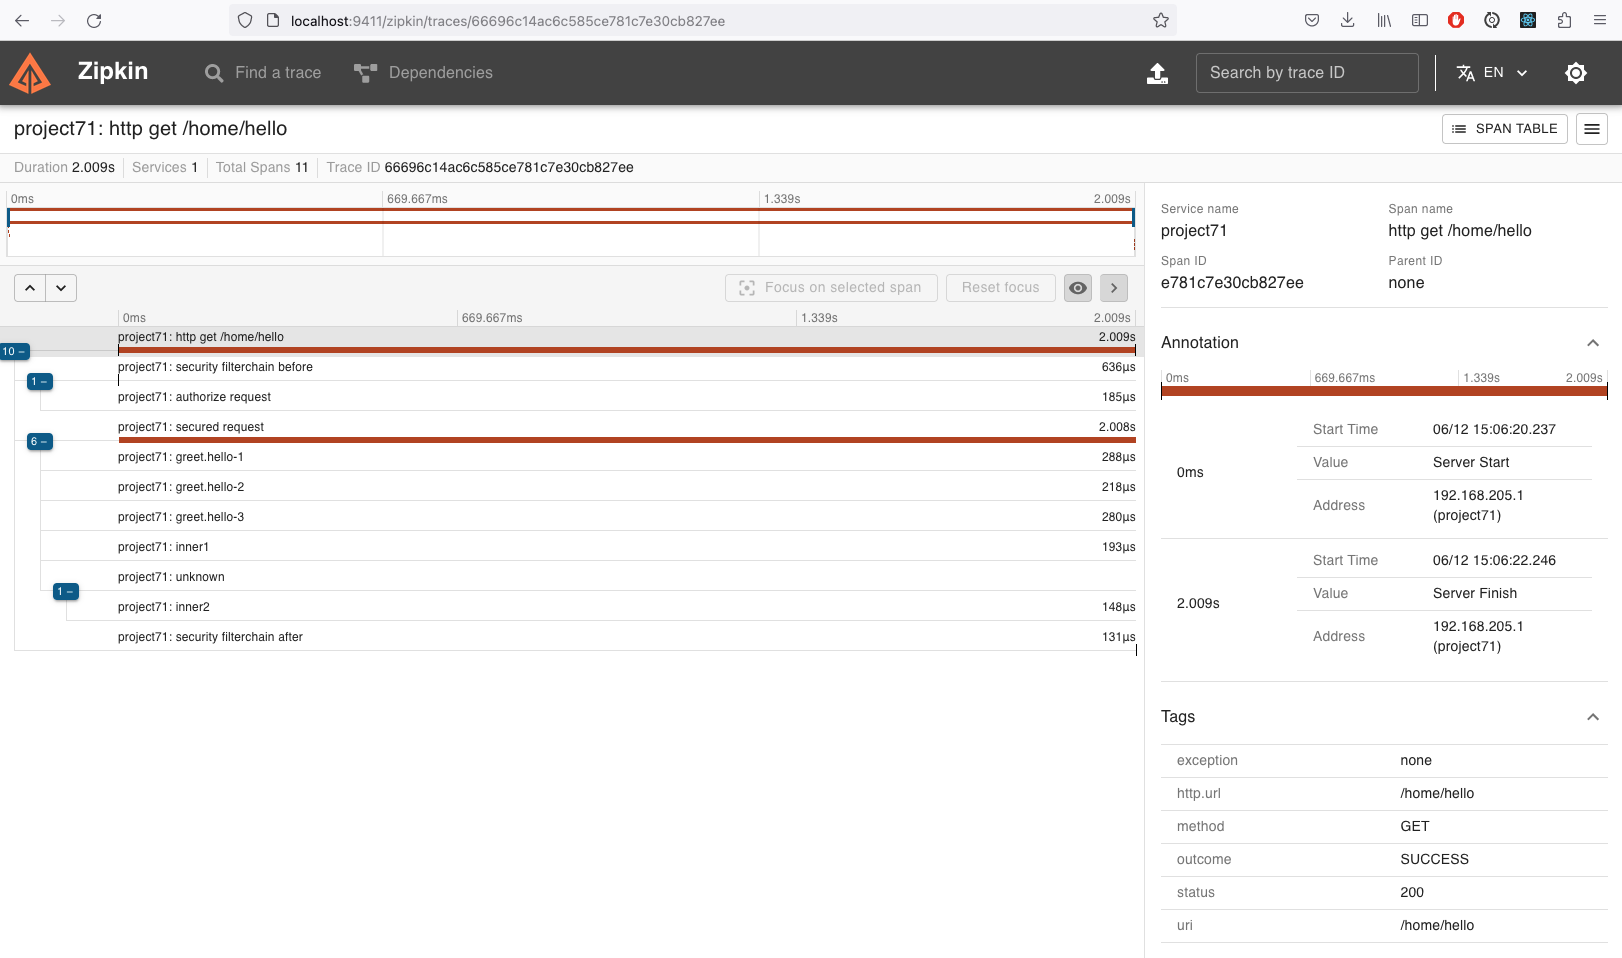
Open zipkin dashboard
Open prometheus dashboard
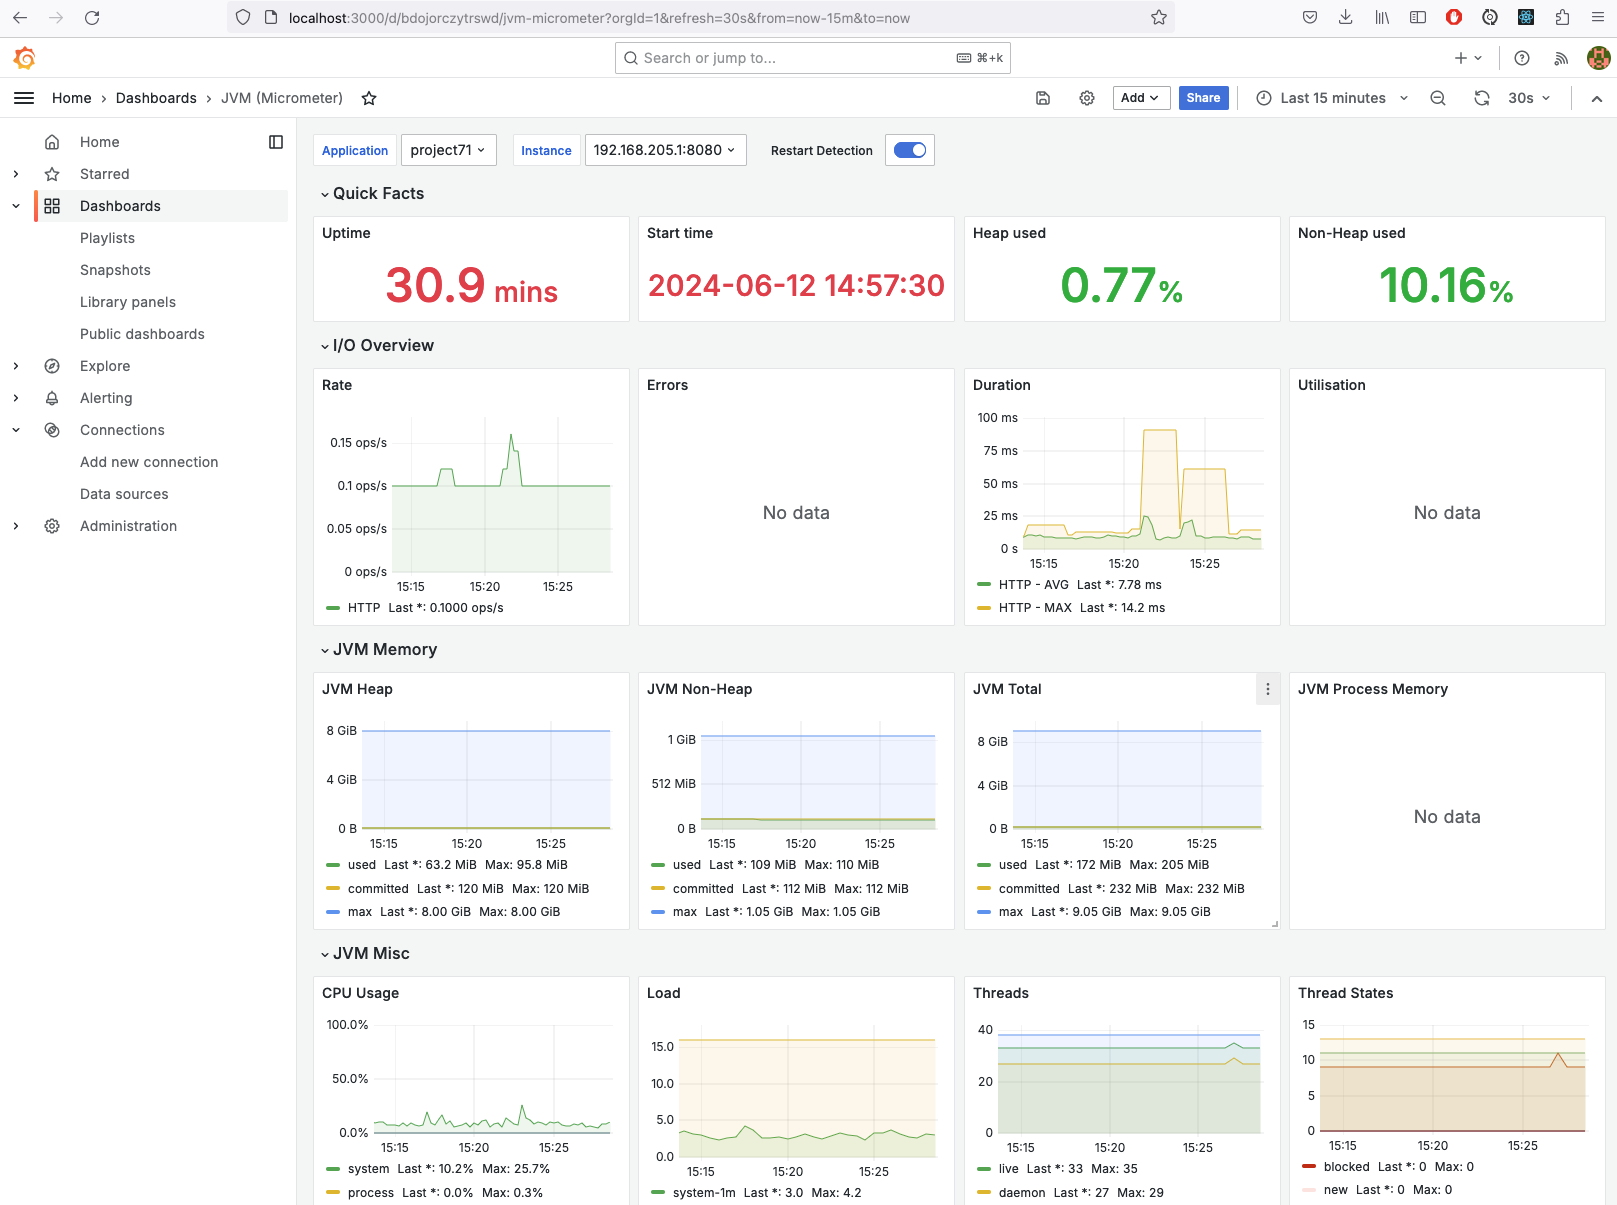
Open grafana dashboard
1user: admin
2password: admin
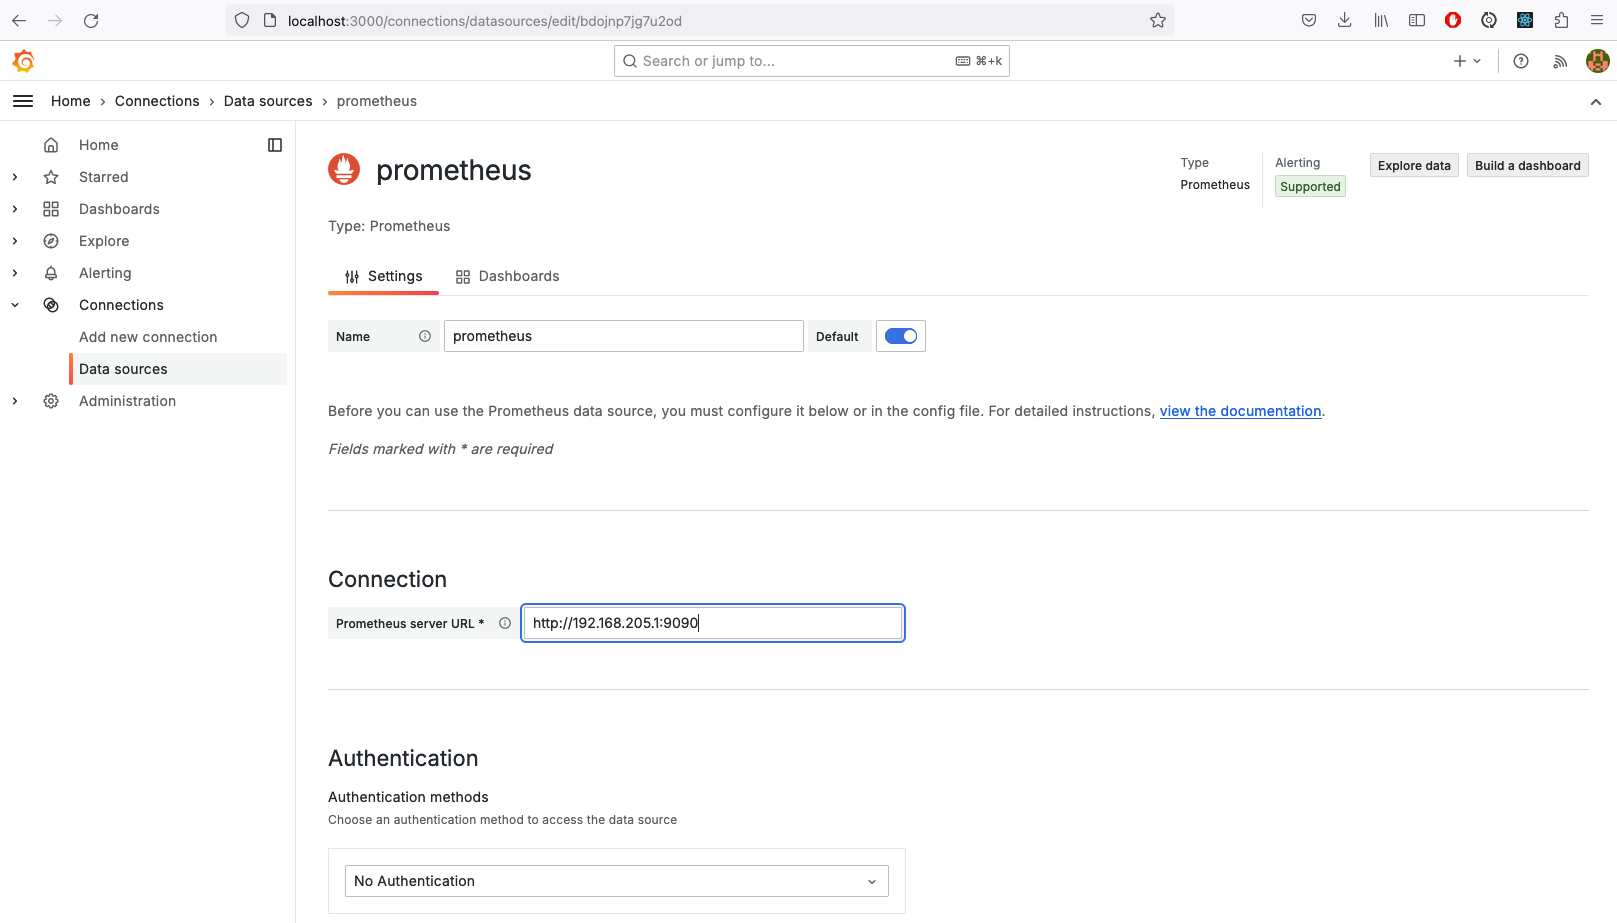
Add the prometheus data source, make sure it's the ip address of your system, don't add localhost
http://IP-ADDRESS:9090
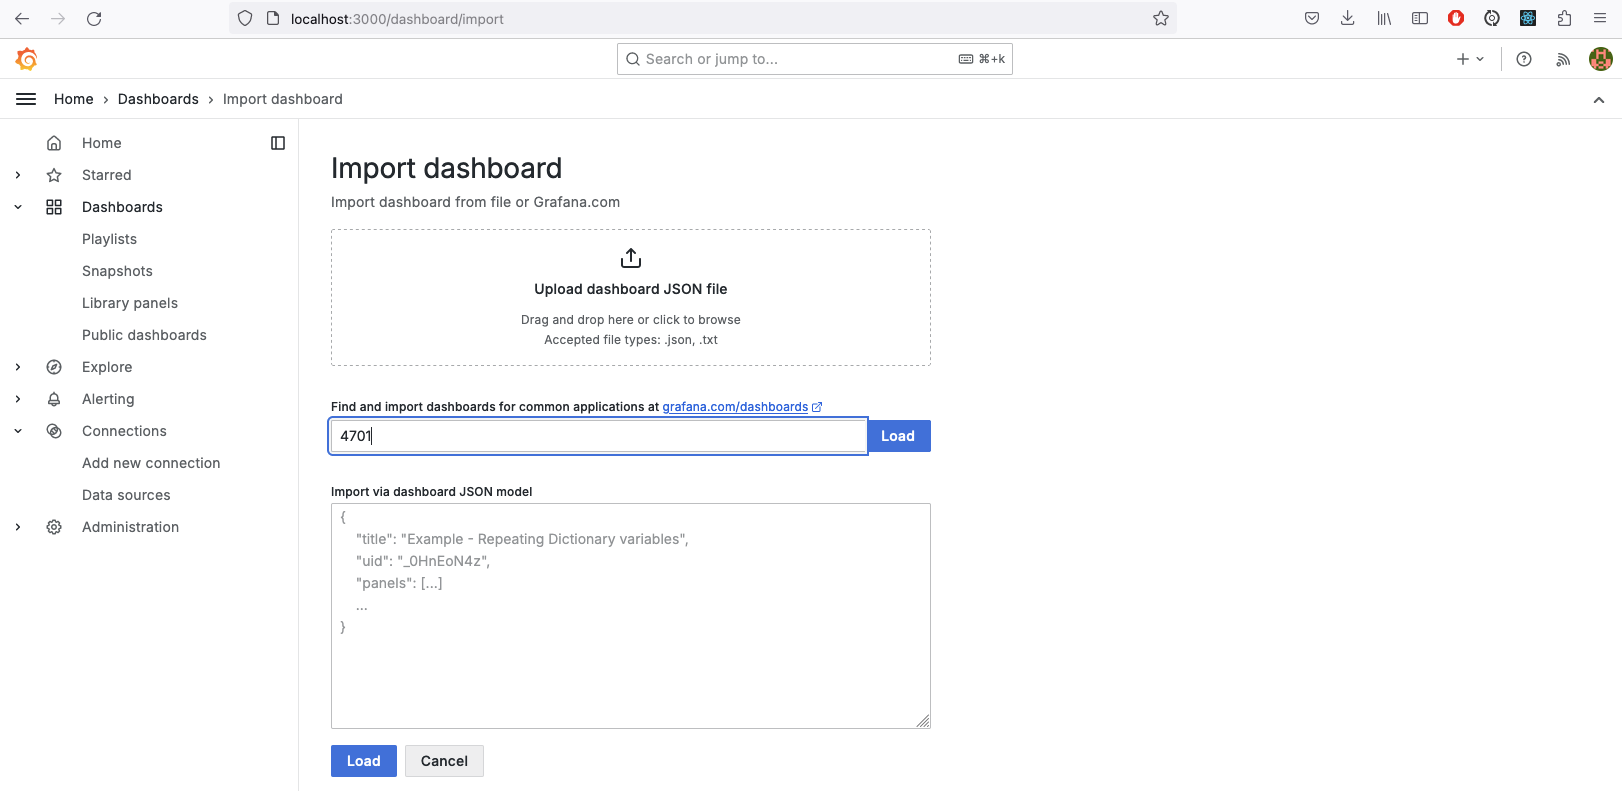
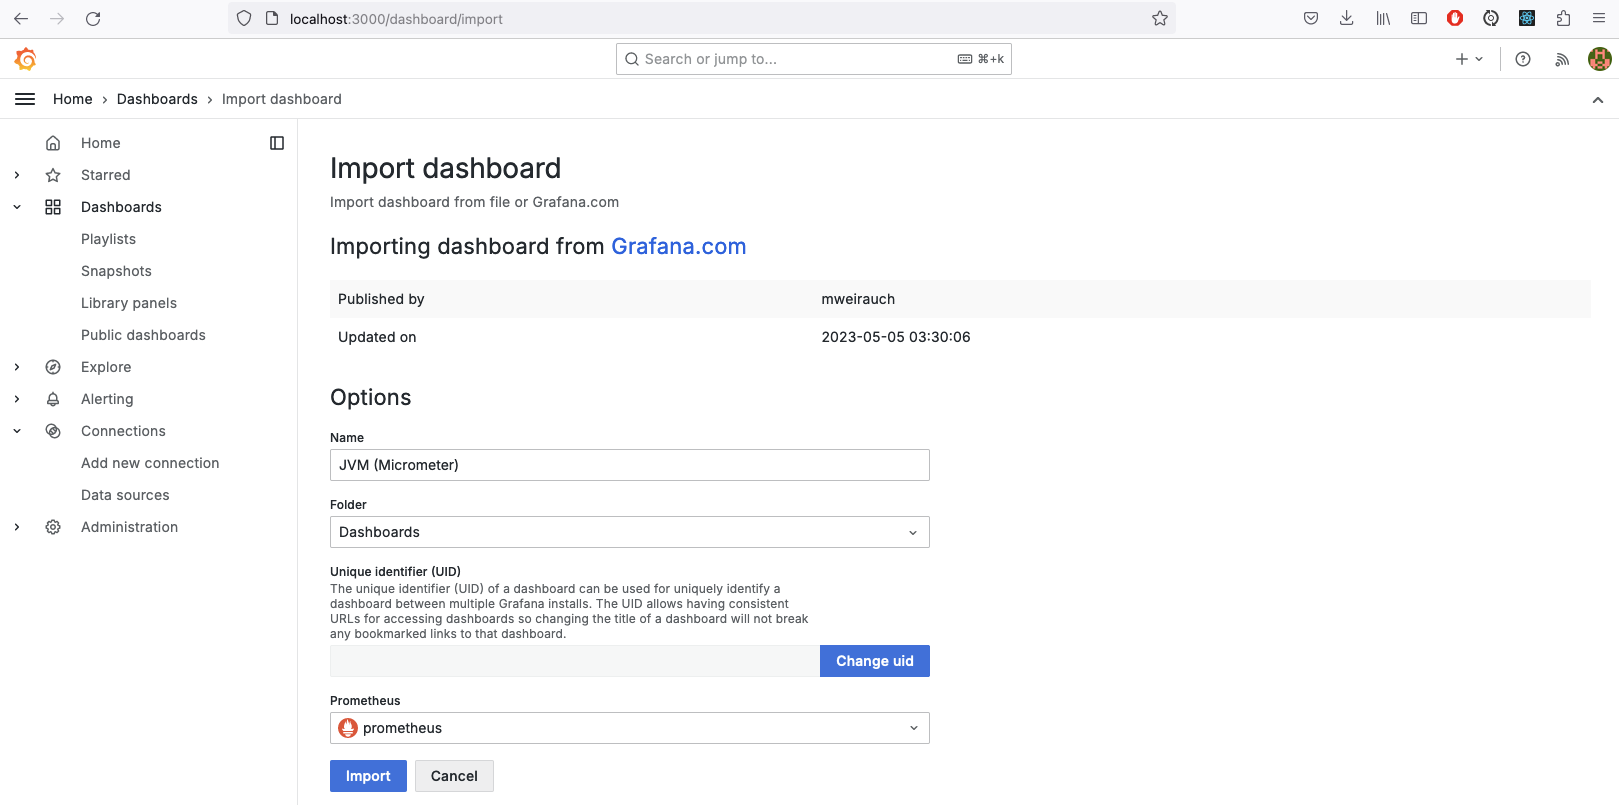
There are existing grafana dashboards that can be imported. Import a dashboard, Download the json file or copy the ID of the dashboard for micrometer dashboard.
https://grafana.com/dashboards/4701
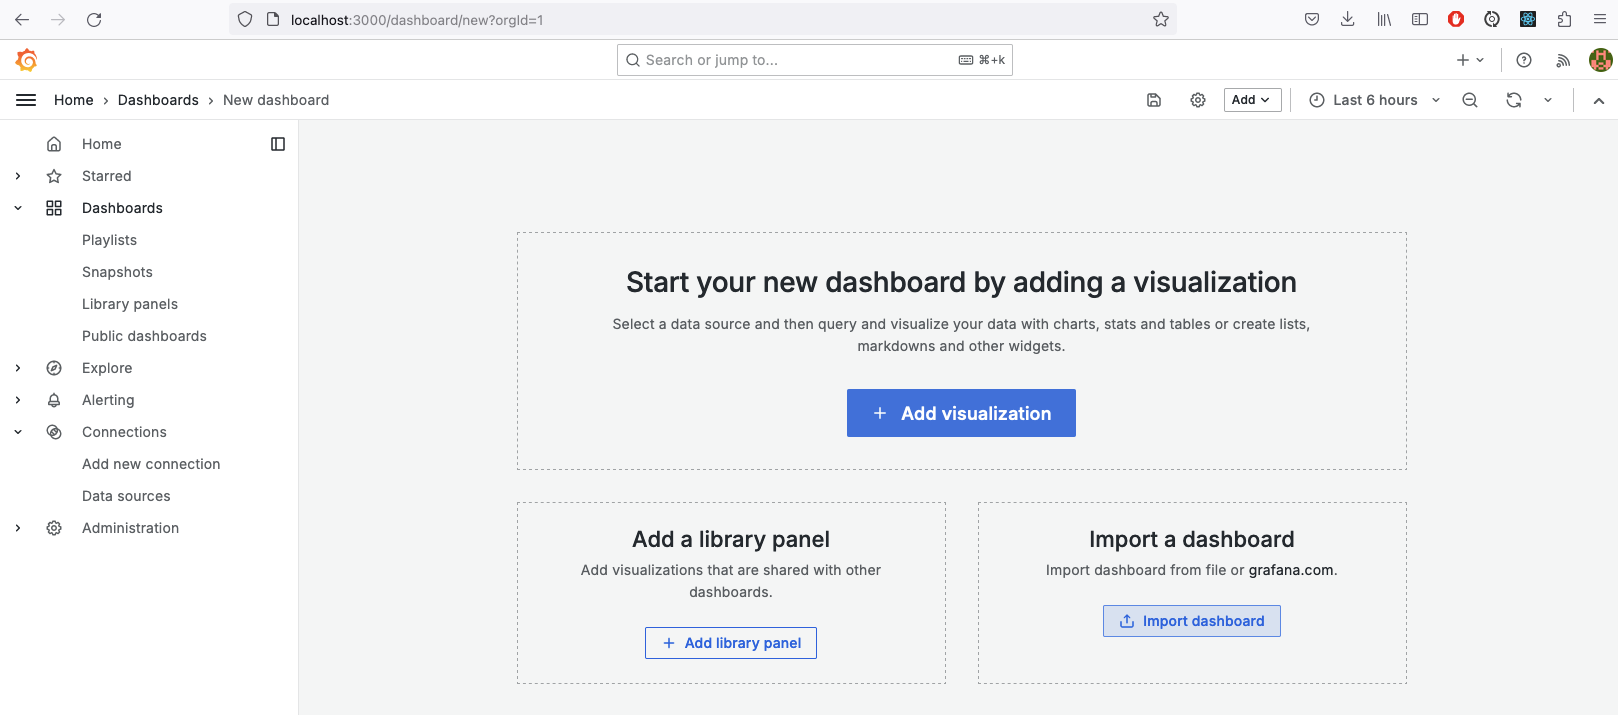
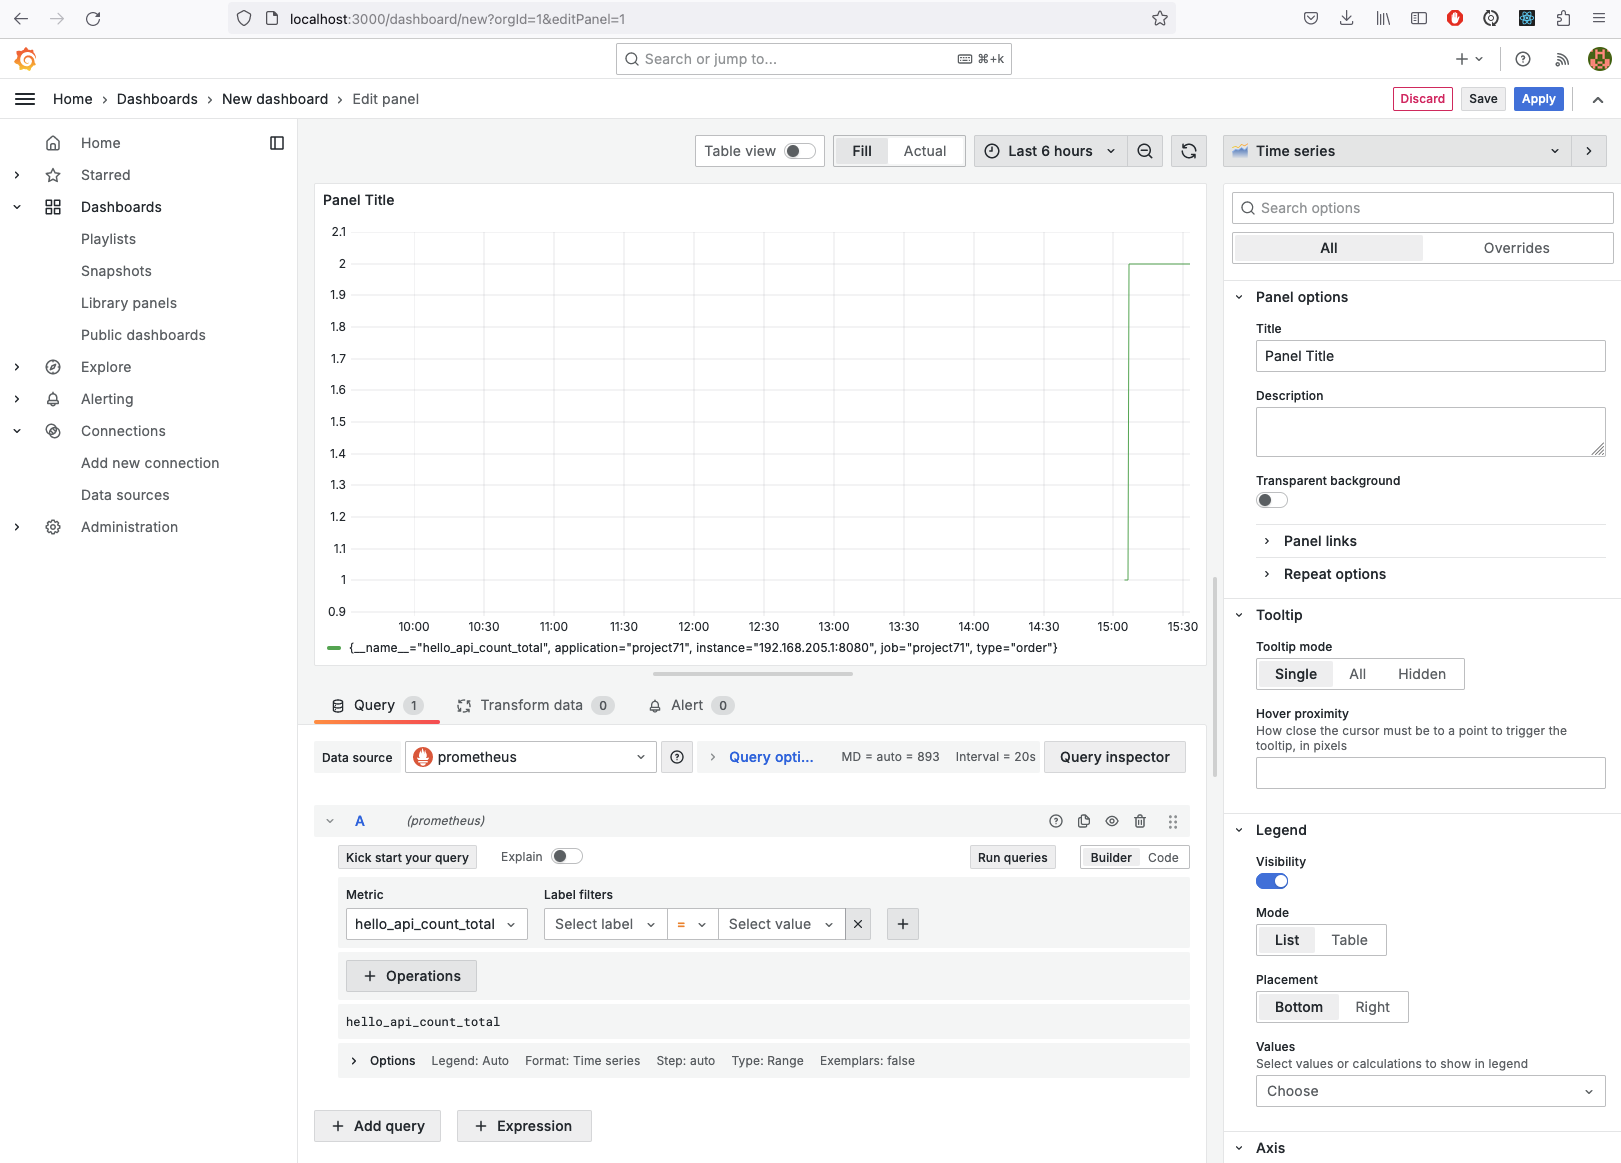
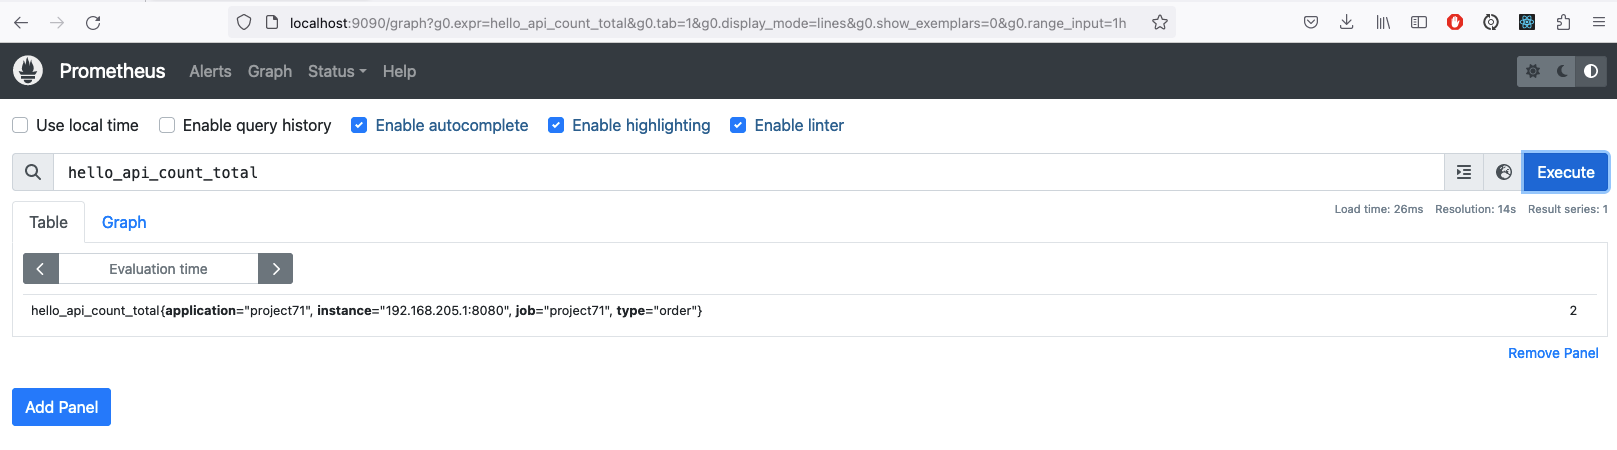
Create a custom dashboard, Add a new panel, add 'hello_api_count_total' metric in the query, save the dashboard.